Summary Background
REGIONAL ECONOMIC ANALYSIS OF NORTHWEST LOWER MICHIGAN
The following outlines various economic analyses conducted as part of this CEDS planning process. Collectively, these anecdotal analyses provide a clearer picture of the region’s industries and workforce, which provide the various Economic Development Organizations and Networks Northwest the information needed to make effective decisions towards a sustainable economy.
LOCATION QUOTIENTS
The measure of the local concentration of industry and occupation against the national average provides a location quotient (LQ) score, with scores of 1 or greater having a higher concentration of that industry and occupation. LQ measures employment (i.e. jobs) by industry concentration in an area, and is not a measure of people’s employment. It is important to note that a high LQ score doesn’t directly translate to the largest employer by employee count for an area. Other industries with lower LQ scores may display greater employment, but those industries would have less concentration in the area as compared to nationally.
Analysis of LQ scores allows planners, economic developers, and policy makers to gain an understanding of the industry make-up of an area through identification of over-saturation of certain industries and also through emerging or growing industries. Diversification of industries and industry employment is a fundamental objective, which supports employment resiliency through variation of the employment market.
Top 5 Industry Sub-Sectors by County
ANTRIM COUNTY
- Crop Production
- Machinery Manufacturing
- Beverage & Tobacco Product Manufacturing
- Accommodation
- Amusement, Gambling, and Recreation Industries
2020 to 2024 Changes:
Reordering of industries by LQ and the former top 5 category of ‘Unclassified’ was replaced by ‘Amusement, gambling, and recreation industries’
Largest Employers outside of the Top 5 Industries by LQ are:
‘Food Services and Drinking Places’ and ‘Food and Beverage Retailers’ displaying that these service and retail oriented businesses support a significant portion of employment opportunities.
CHARLEVOIX COUNTY
- Plastics & Rubber Product Manufacturing
- Accommodation
- Utilities
- Machine Manufacturing
- Computers & Electronic Product Manufacturing
2020 to 2024 Changes:
Reordering of industries by LQ and the former top 5 category of ‘Amusements, gambling and Recreation’ was replaced with ‘Machinery Manufacturing’
Largest Employers outside of the Top 5 Industries by LQ are:
‘Food Services and Drinking Places’ and ‘Nursing and Residential Care Facilities’ display that service oriented positions and those of the healthcare services field support significant employment positions.
GRAND TRAVERSE COUNTY
- Textile Product Mills
- Beverage & Tobacco Product Manufacturing
- Unclassified
- Building Material & Garden Supply Stores
- Machine Manufacturing
2020 to 2024 Changes:
Reordering of industries by LQ and the former top 5 category of ‘Furniture & Home Furnishings’ was replaced with the ‘Unclassified’ category.
Largest Employers outside of the Top 5 Industries by LQ are:
‘Food Services and Drinking Places’ and ‘Ambulatory Health Care Services’ display that service oriented positions and those of the healthcare services field support significant employment positions.
LEELANAU COUNTY
- Beverage & Tobacco Manufacturing
- Crop Production
- Unclassified
- Museums, Historical Sites, and Similiar Institutions
- Construction of Buildings
2020 to 2024 Changes:
Reordering of industries by LQ and the former top 5 category of ‘Miscellaneous Store Retailers’ was replaced with ‘Museums, Historical Sites, and Similar Institutions’ category.
Largest Employers outside of the Top 5 Industries by LQ are:
‘Food Services and Drinking Places’ and ‘Food and Beverage Retailers’ displaying that these service and retail oriented businesses support a significant portion of employment opportunities.
MISSAUKEE COUNTY
- Animal Product Production
- Forestry & Logging
- Support Activities for Agriculture and Forestry
- Wood Product Manufacturing
- Crop Production
2020 to 2024 Changes:
Reordering of industries by LQ and the former top 5 categories of ‘Truck Transportation’ and ‘Gasoline Stations’ were replaced with ‘Crop Production’ and ‘Support Activities for Agriculture and Forestry’
Largest Employers outside of the Top 5 Industries by LQ are:
‘General Merchandise Retailers’ and ‘Nursing and Residential Care Facilities’ displays that service sector positions provide significant employment opportunities.
BENZIE COUNTY
- Animal Production and Aquaculture
- Accommodation
- Waste Management and Remediation Services
- Gasoline Stations and Fuel Dealers
- Food Manufacturing
2020 to 2024 Changes:
Reordering of industries by LQ and the former top 5 categories of ‘Building materials & Garden Supply Stores’ and ‘Amusements, Gambling and Recreation’ were replaced with ‘Animal production and aquaculture’ and ‘Waste Management and remediation services’
Largest Employers outside of the Top 5 Industries by LQ are:
‘Food Services and Drinking Places’ and ‘Specialty Trade Contractors’ displaying that food and drinking establishments support substantial service oriented employment positions and skilled trades and contractors make up a large portion of employment.
EMMET COUNTY
- Accommodation
- Beverage & Tobacco Product Manufacturing
- Building Material & Garden Supply Stores
- Construction of Buildings
- Amusements, Gambling and Recreation
2020 to 2024 Changes:
Reordering of industries by LQ, the top 5 categories remain unchanged from 2020.
Largest Employers outside of the Top 5 Industries by LQ are:
‘Food Services and Drinking Places’ and ‘Ambulatory Health Care Services’ display that service oriented positions and those of the healthcare services field support significant employment positions.
KALKASKA COUNTY
- Crop Production
- Heavy & Civil Engineering Construction
- Fabricated Metal Product Manufacturing
- Forestry and Logging
- Specialty Trade Contractors
2020 to 2024 Changes:
Reordering of industries by LQ and the former top 5 category of ‘Gasoline Stations’ and ‘Unclassified’ were replaced with ‘Forestry and Logging’ and ‘Specialty Trade Contractors’ categories.
Largest Employers outside of the Top 5 Industries by LQ are:
‘Food Services and Drinking Places’ and ‘Food and Beverage Retailers’ displaying that these service and retail oriented businesses support a significant portion of employment opportunities.
MANISTEE COUNTY
- Accomodation
- Beverage and Tobacco Product Manufacturing
- Building Material and Garden Equipment and Supplies Dealers
- Construction of Buildings
- Amusements, Gambling, and Recreation
2020 to 2024 Changes:
Reordering of industries by LQ, the top 5 categories remain unchanged from 2020.
Largest Employers outside of the Top 5 Industries by LQ are:
‘Food Services and Drinking Places’ and ‘Ambulatory Health Care Services’ display that service oriented positions and those of the healthcare services field support significant employment positions.
WEXFORD COUNTY
- Forestry & Logging
- Plastics & Rubber Products Manufacturing
- Transportation Equipment Manufacturing
- Couriers and Messengers
- Fabricated Metal Product Manufacturing
2020 to 2024 Changes:
Reordering of industries by LQ and the former top 5 category of ‘Truck Transportation’ was replaced with ‘Couriers and Messengers’
Largest Employers outside of the Top 5 Industries by LQ are:
‘Food Services and Drinking Places’ and ‘General Merchandise Retailers’ displaying the service and retail sector positions provide significant employment opportunities.
ECONOMIC DEPENDENCY RATIO
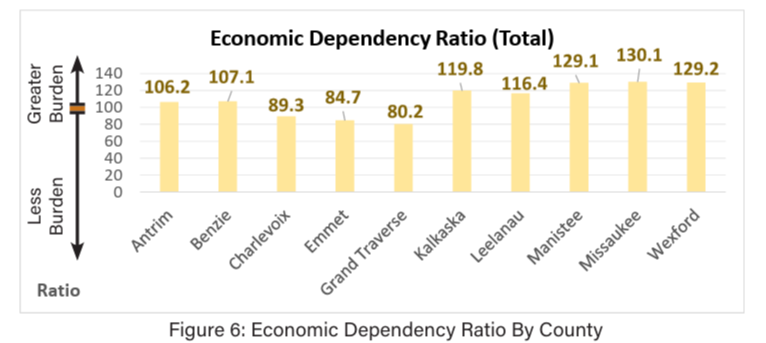
Economic Dependency Ratio (EDR) is the measure of ‘non-workers’ relative to the number of employed individuals in a geographic area. The ratio compares non-workers for every 100 workers, and includes all members of the population who are not employed, excluding prisoners and service members. A score less than 100 indicates that the ratio weighs towards the workforce being greater than the identified dependent. Therefore a higher ratio indicates that there is a greater burden on working age population with more dependents who are not engaged in the workforce. Counties which have higher ratios, and also display low percentages of youthful age cohorts, with an aging population, can estimate that burden will likely increase on the working age population. Burden is defined as constrained financial support for educational facilities, community facilities, and community resources which are largely supported by the working population. Each county’s Economic Dependency Ratio is displayed on Figure 6.

HOUSING AFFORDABILITY INDEX
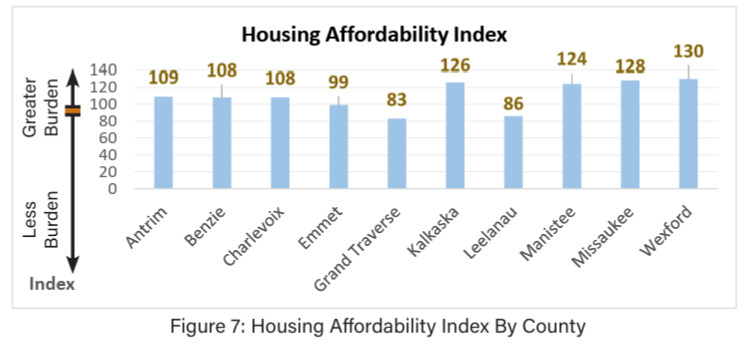
The Housing Affordability Index measures the financial ability of a typical household to purchase an existing home in an area. An index of 100 indicates that on average an area has a sufficient median household income to afford a home. As one moves below an index of 100, this displays that housing is less affordable. For example an index of 75 would mean that a household would need to earn 25% more to afford the median priced home, while an index of 125 displays that a household would be able to afford a home that is listed at 25% more than the median home prices. Each counties Housing Affordability Index is displayed on Figure 7.

WEALTH INDEX
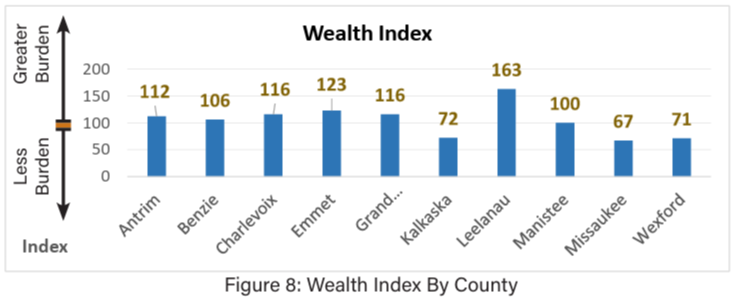
Wealth Index is the measure of the standard of living and financial stability in an area’s households rather than one’s ‘worth’. Wealth is the accumulation of resources, physical possessions & property, or large amounts of money. Wealth is what remains once a householder’s earning power has faded. An index of 100 displays an area’s wealth is on par with the national average, an index below 100 displays an areas lower than average area’s wealth. The wealth index taken into consideration with the percentage of the working population and the age cohorts which comprise the working age population provides information on the status of the community. A large wealth index of greater than 100 is a clear indicator of a populations high financial/asset worth. An index below 100 displays a population has less wealth, if a significant portion of the population is still of working age, and age cohorts display that the working population has years left of earning potential; a lower index may not be as troublesome as the population has time and earning power to increase wealth. An older population, which is less engaged in the workforce coupled with a low Wealth Index could be concerning for the status of the community. Each County’s Wealth Index is displayed on Figure 8.

PERCENTAGE OF INCOME FOR MORTGAGE
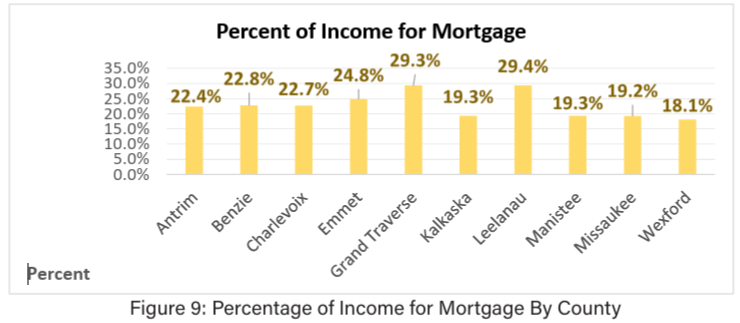
The rate of percent of income allocated for a mortgage displays the impact of a home mortgage on a home buyer’s monthly budget. Lower percentages of income allocated to mortgages are extremely beneficial to households and families due to the constraints placed on budgets by other expenses such as transportation, childcare, food and clothing and other necessary costs. The 28% rule states that a home buyer’s monthly mortgage should not exceed 28% of their monthly income, and is often stated as the 28/36 rule which concludes that overall debt payment doesn’t exceed 36% of a monthly median income which includes mortgage expense. All but two counties in the region have percentages less than 28%. Each County’s Percent of Income for Mortgage is displayed on Figure 9.

