Summary Background
APPENDIX F
Shift-Share Analyses
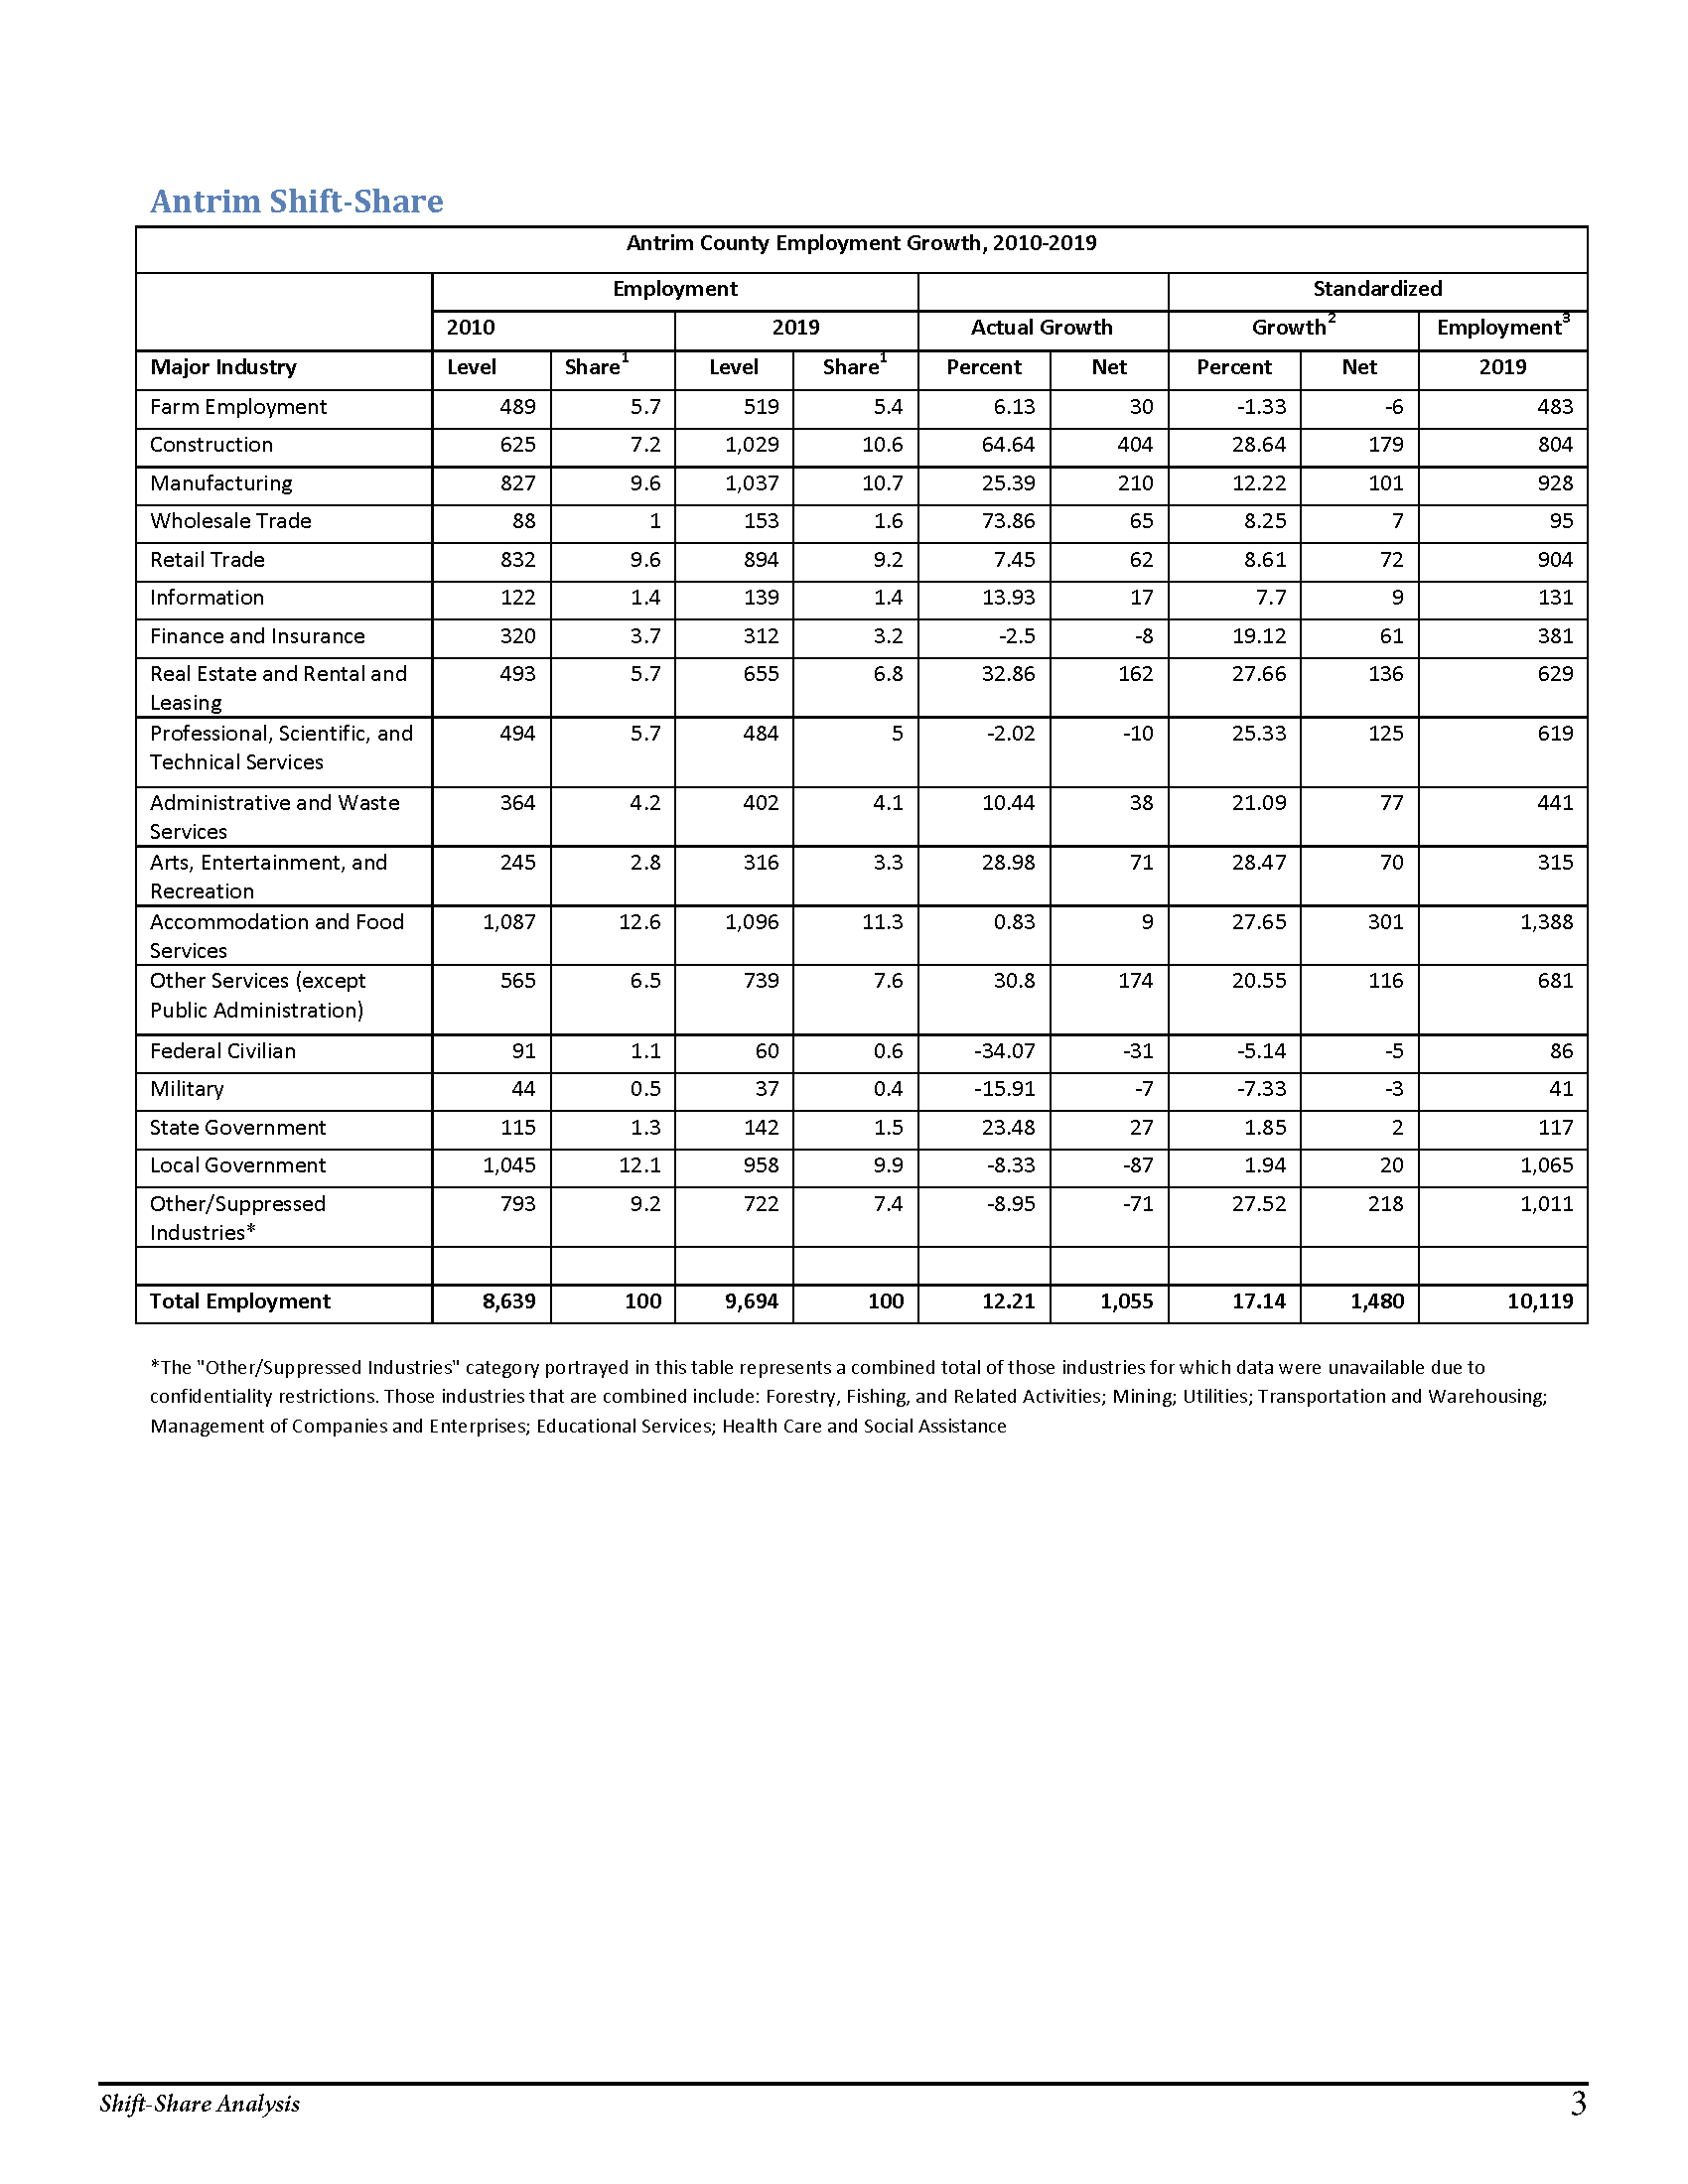
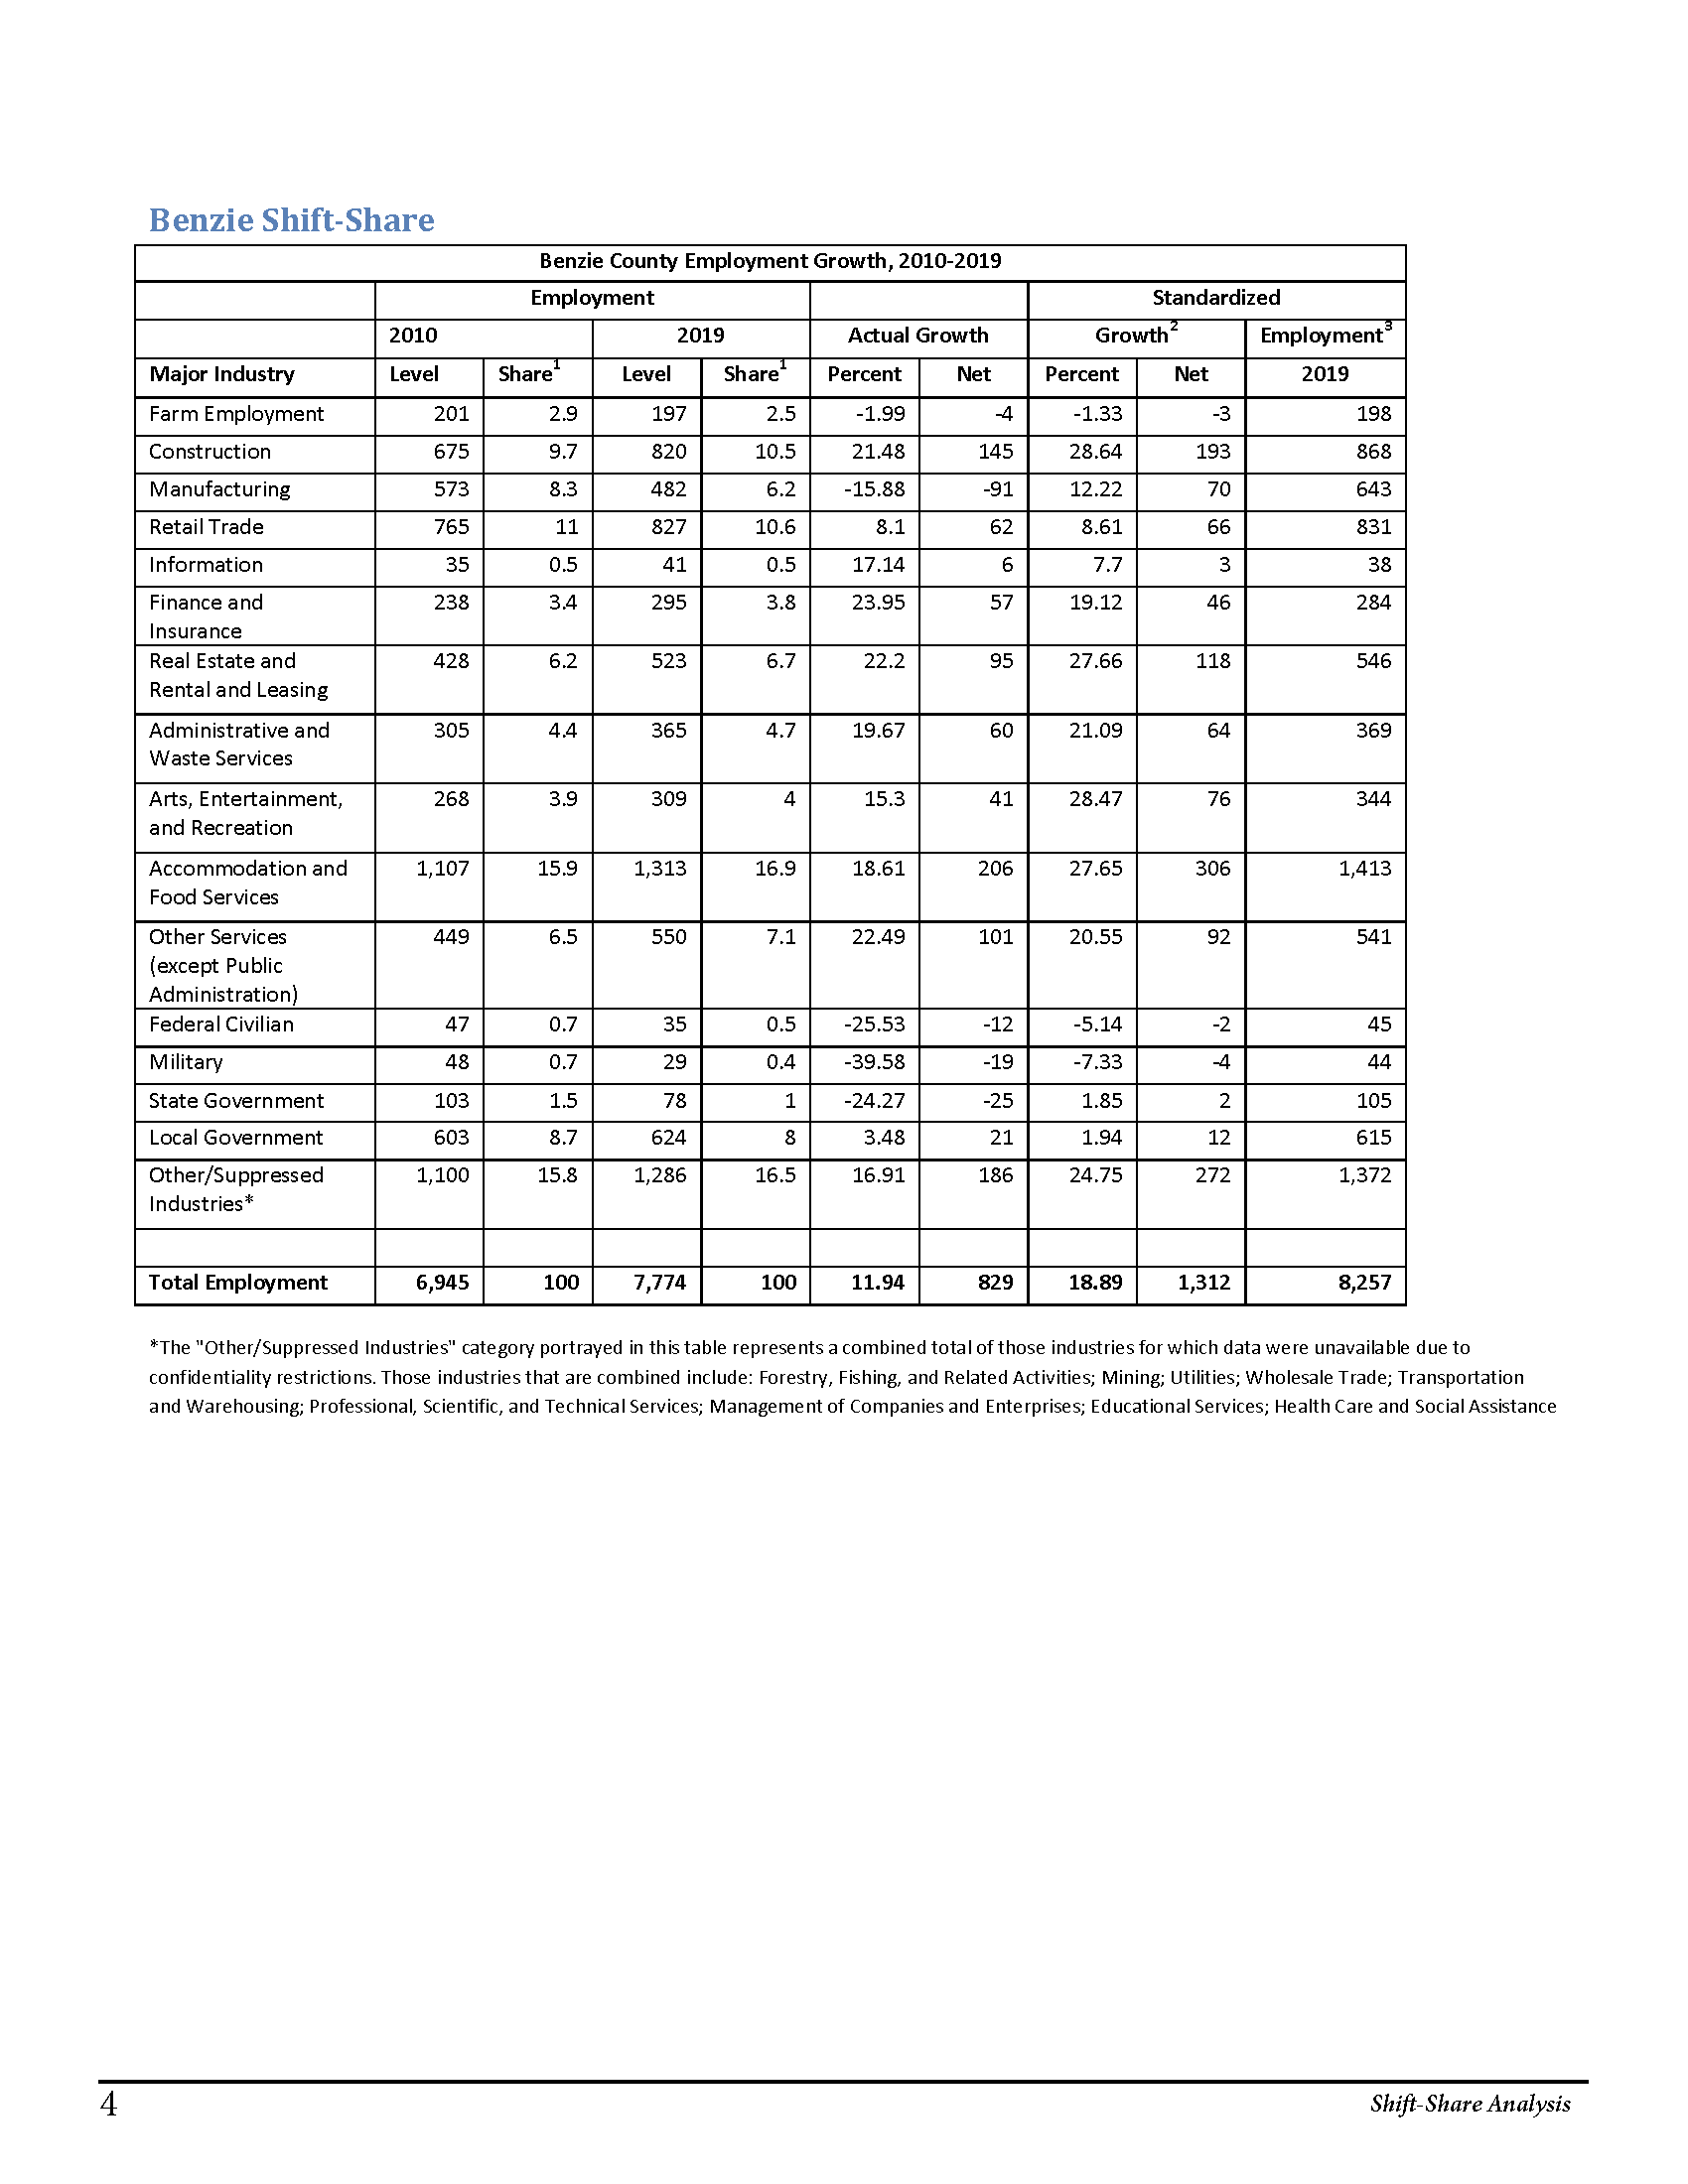
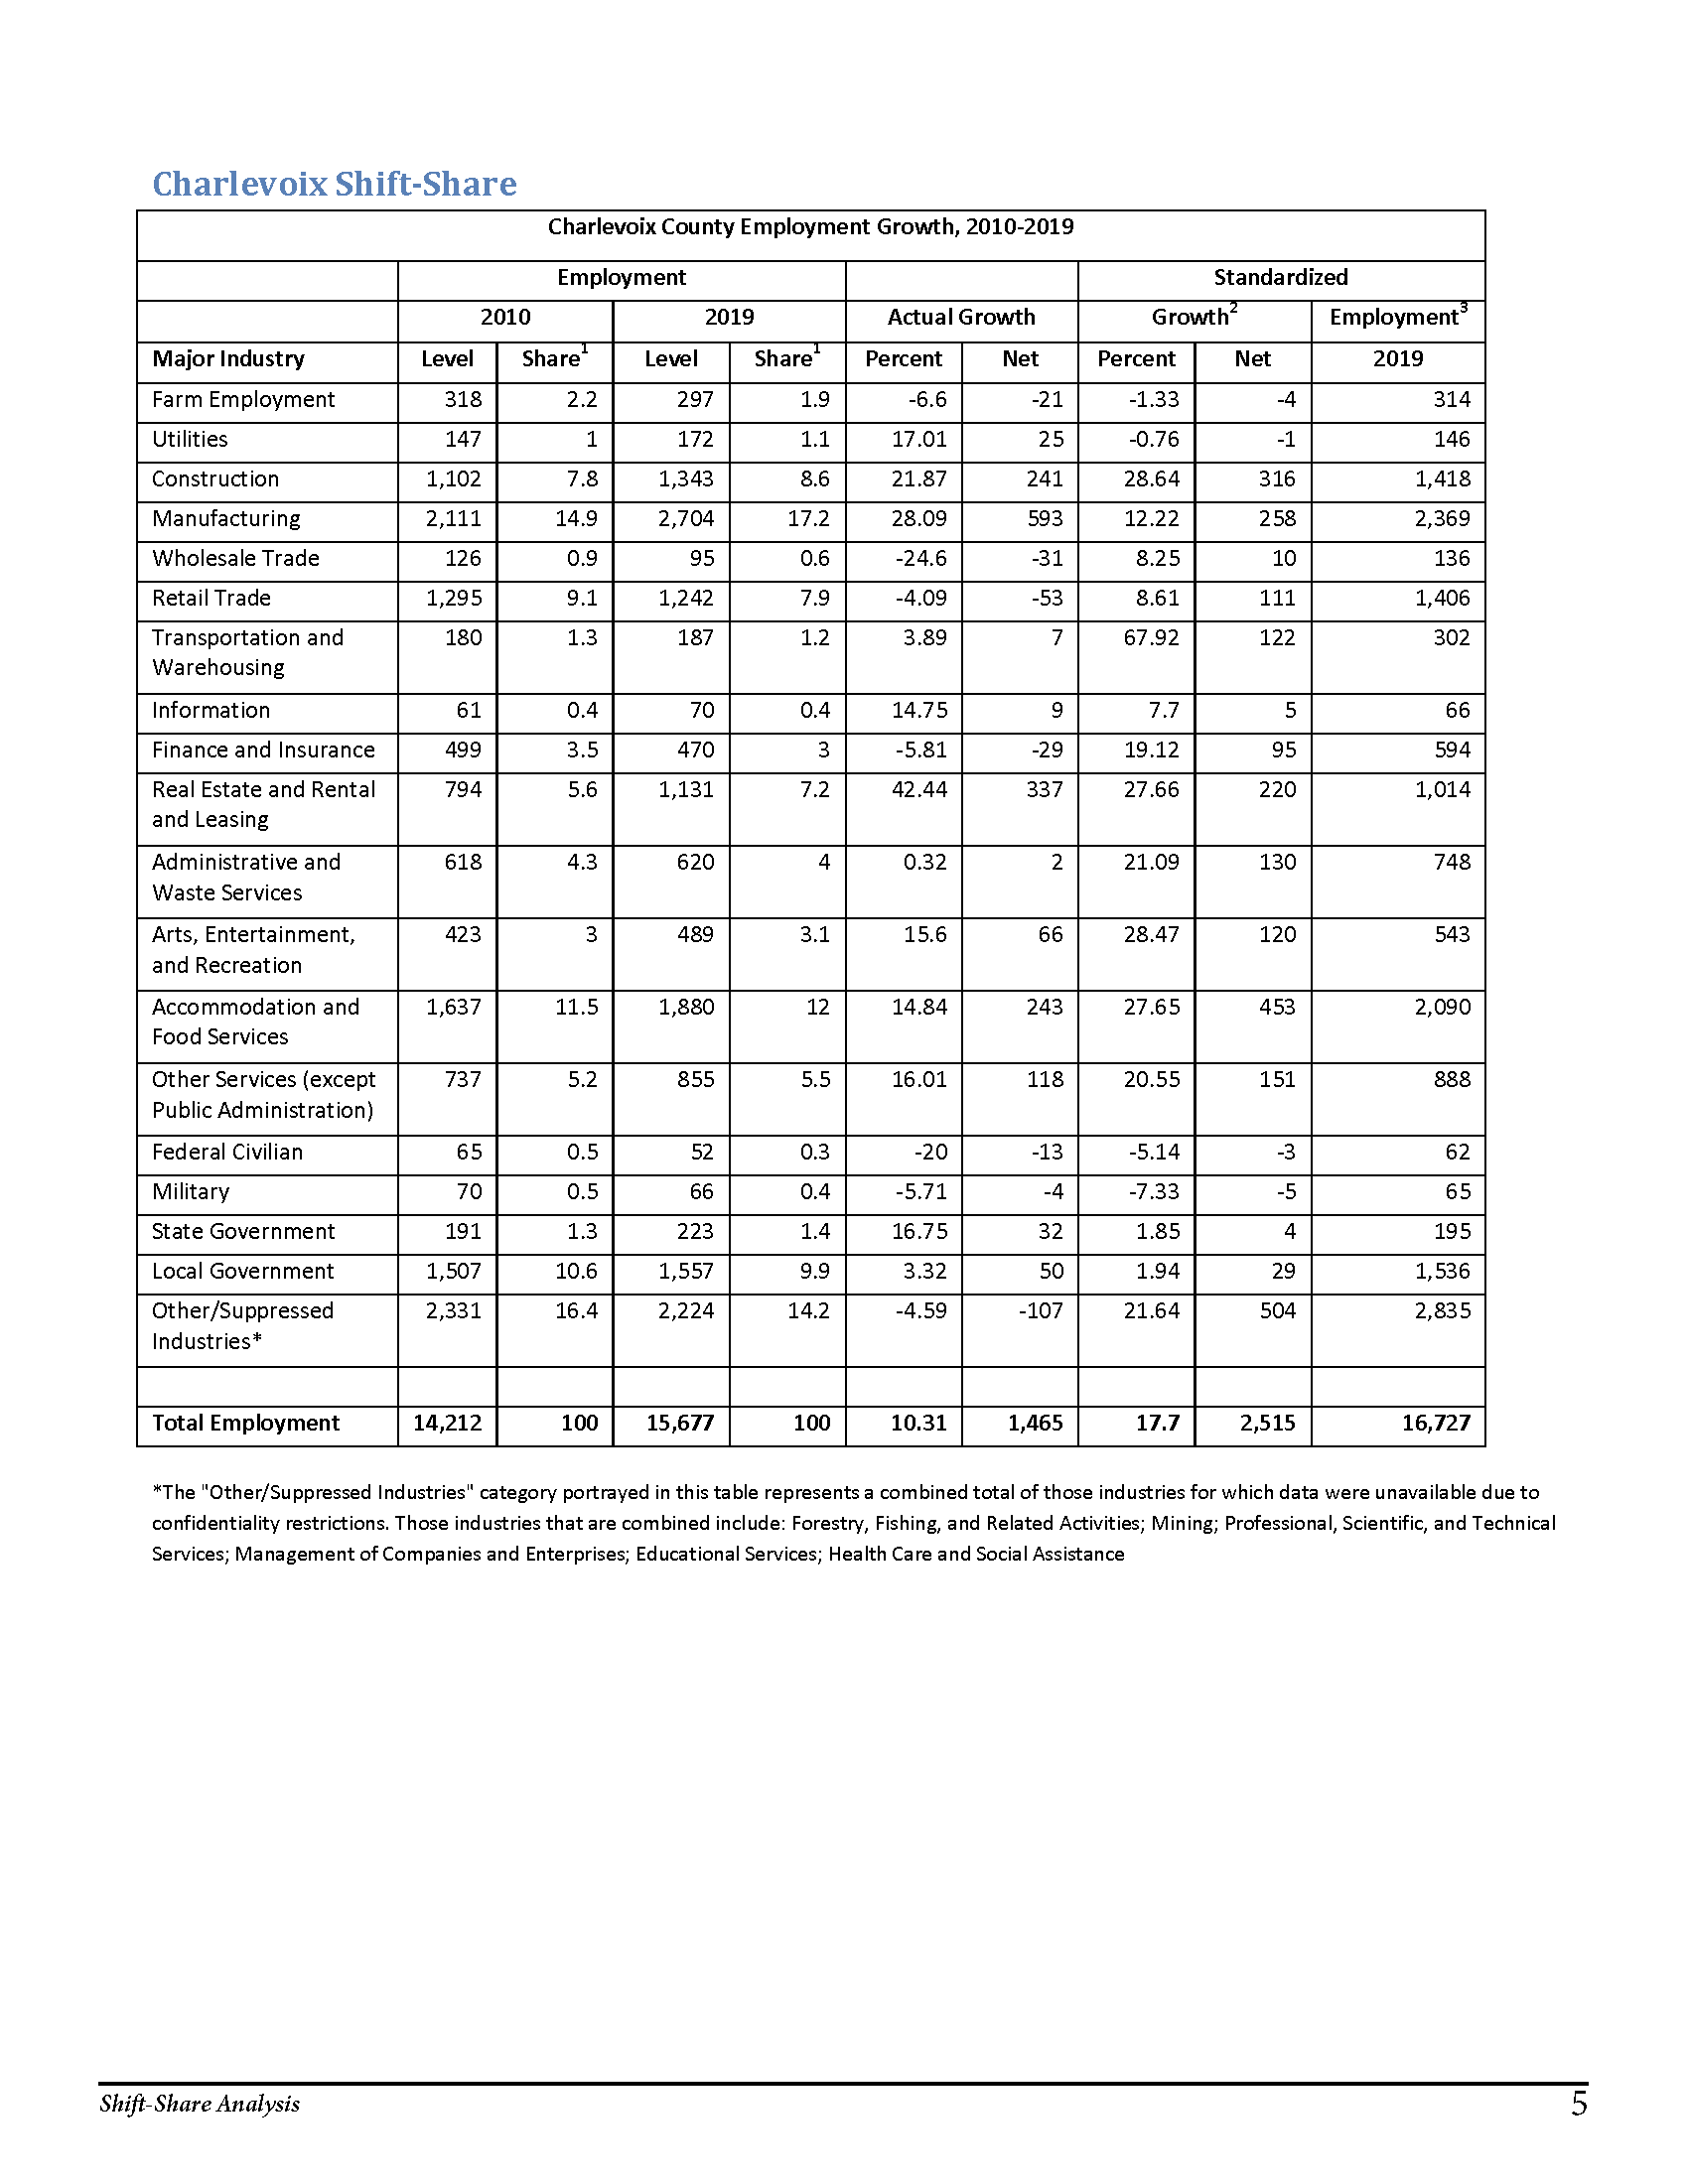
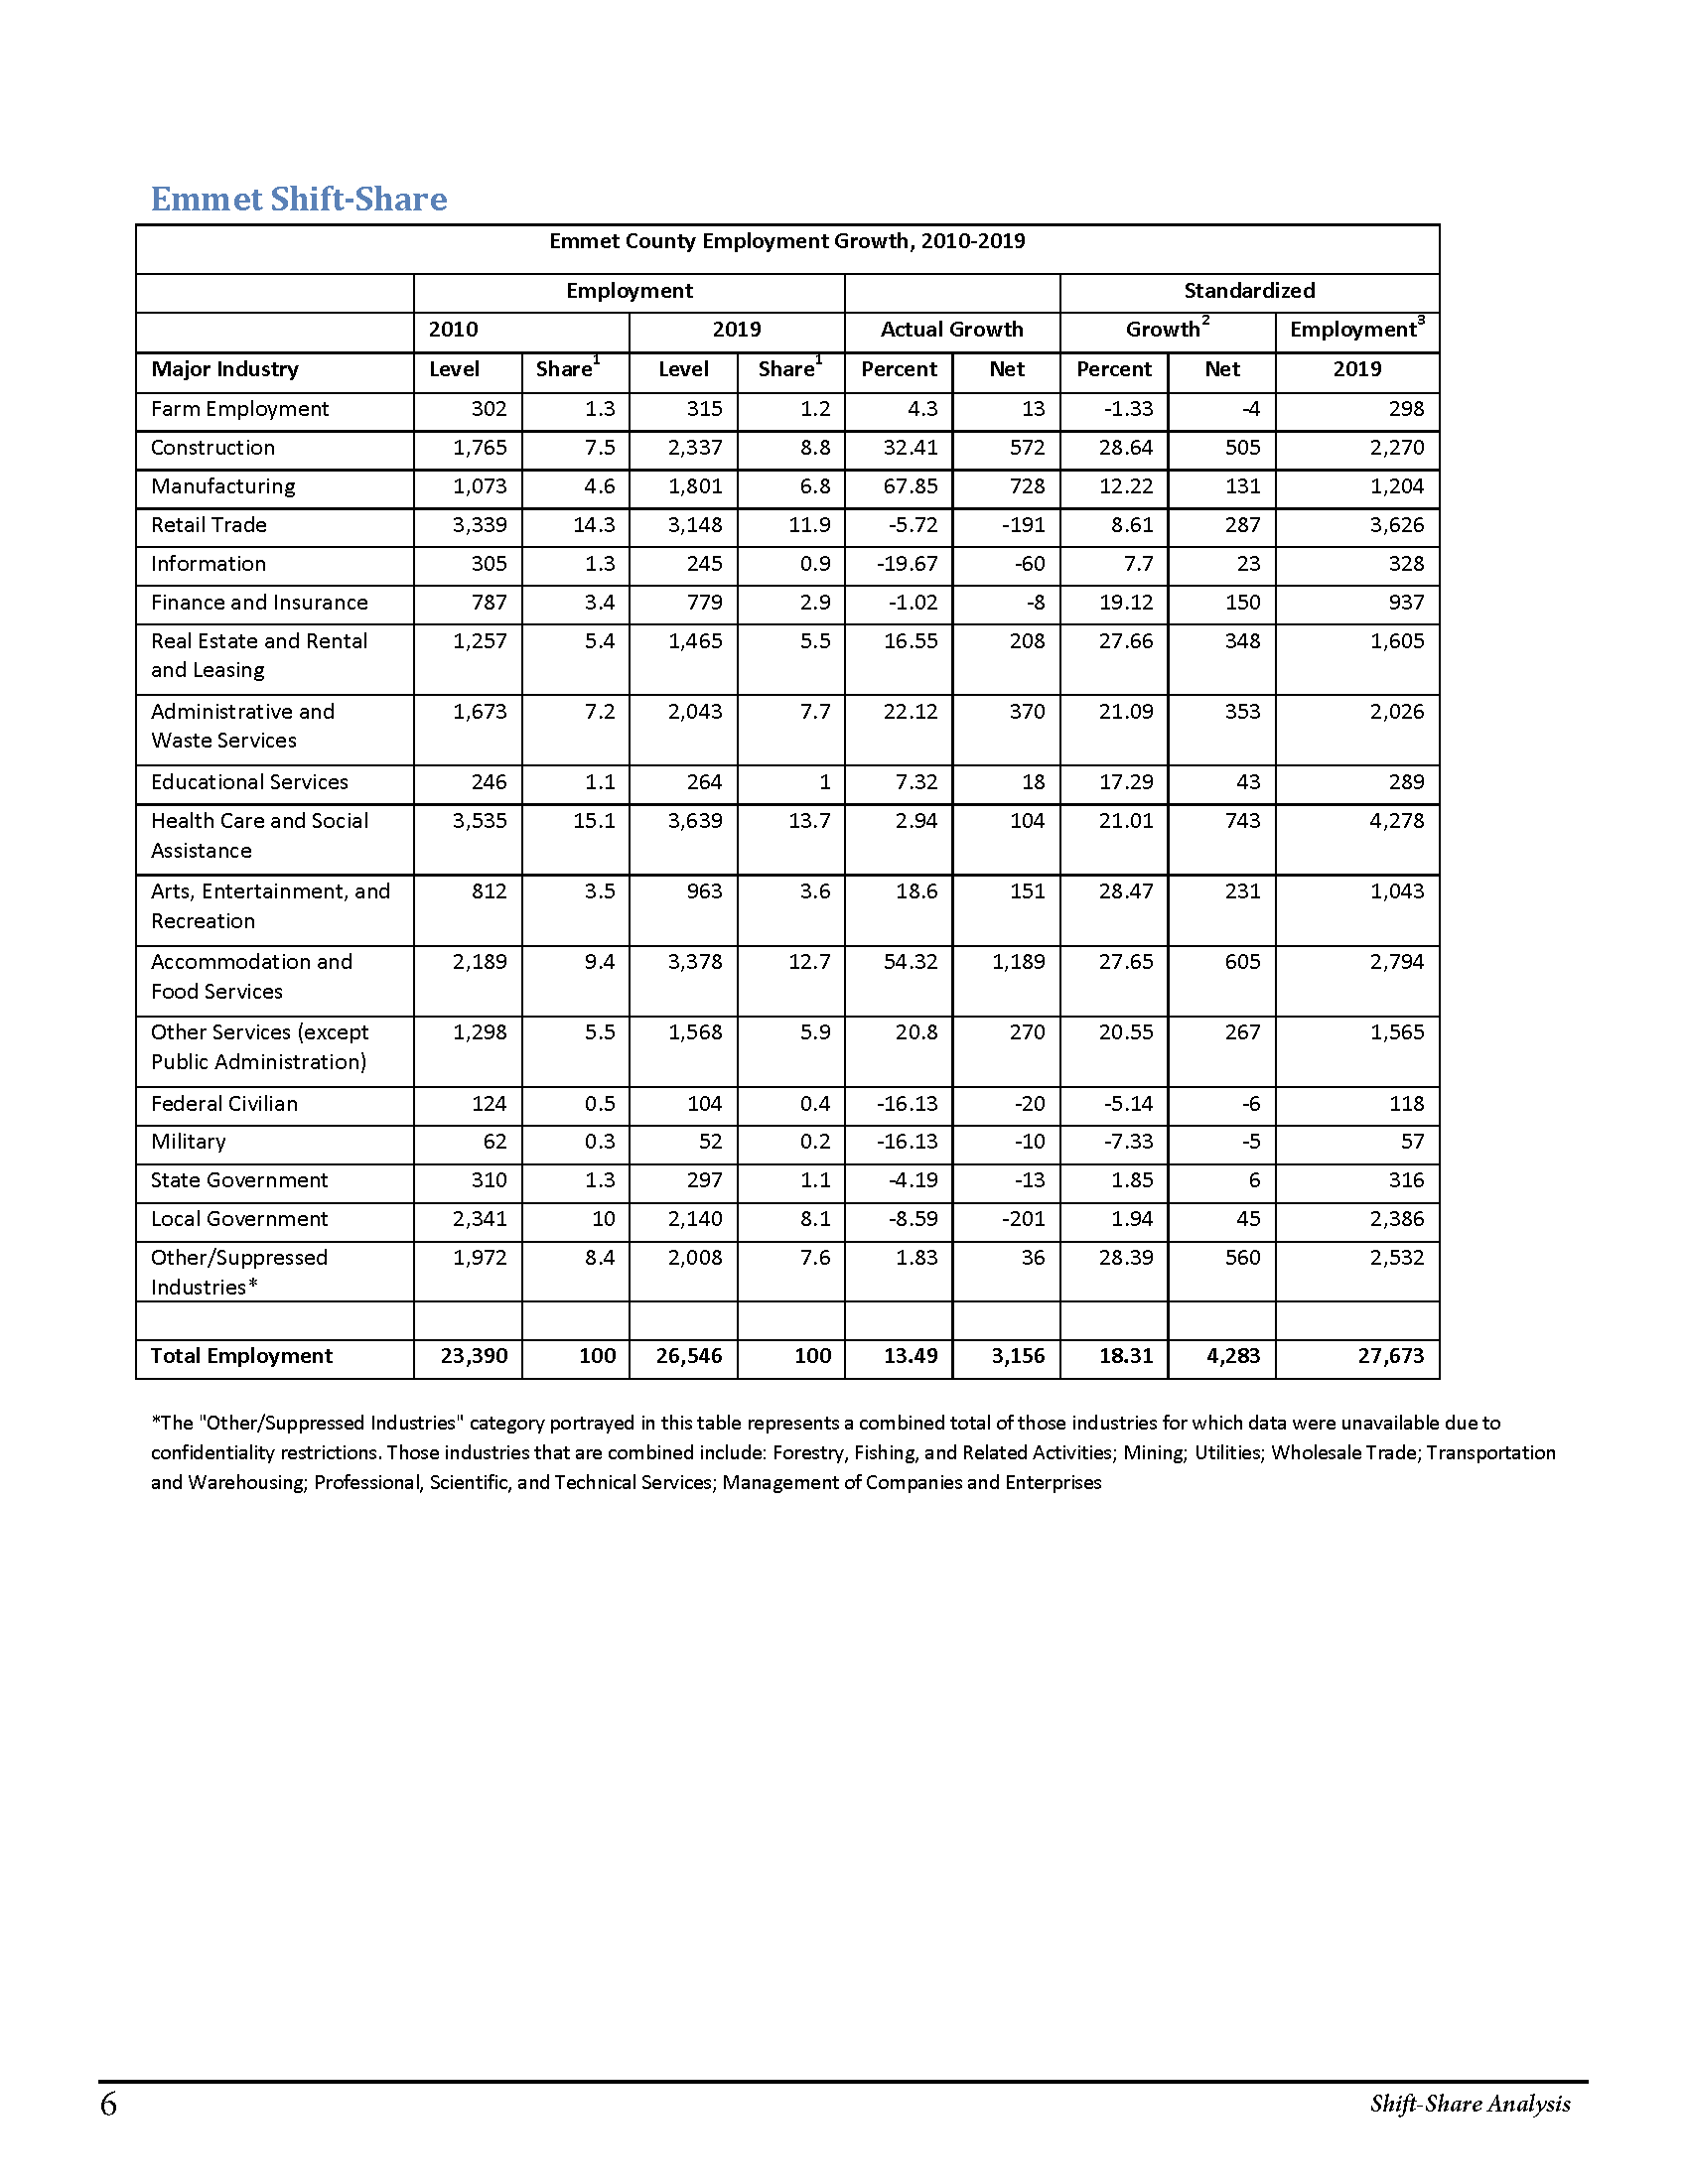
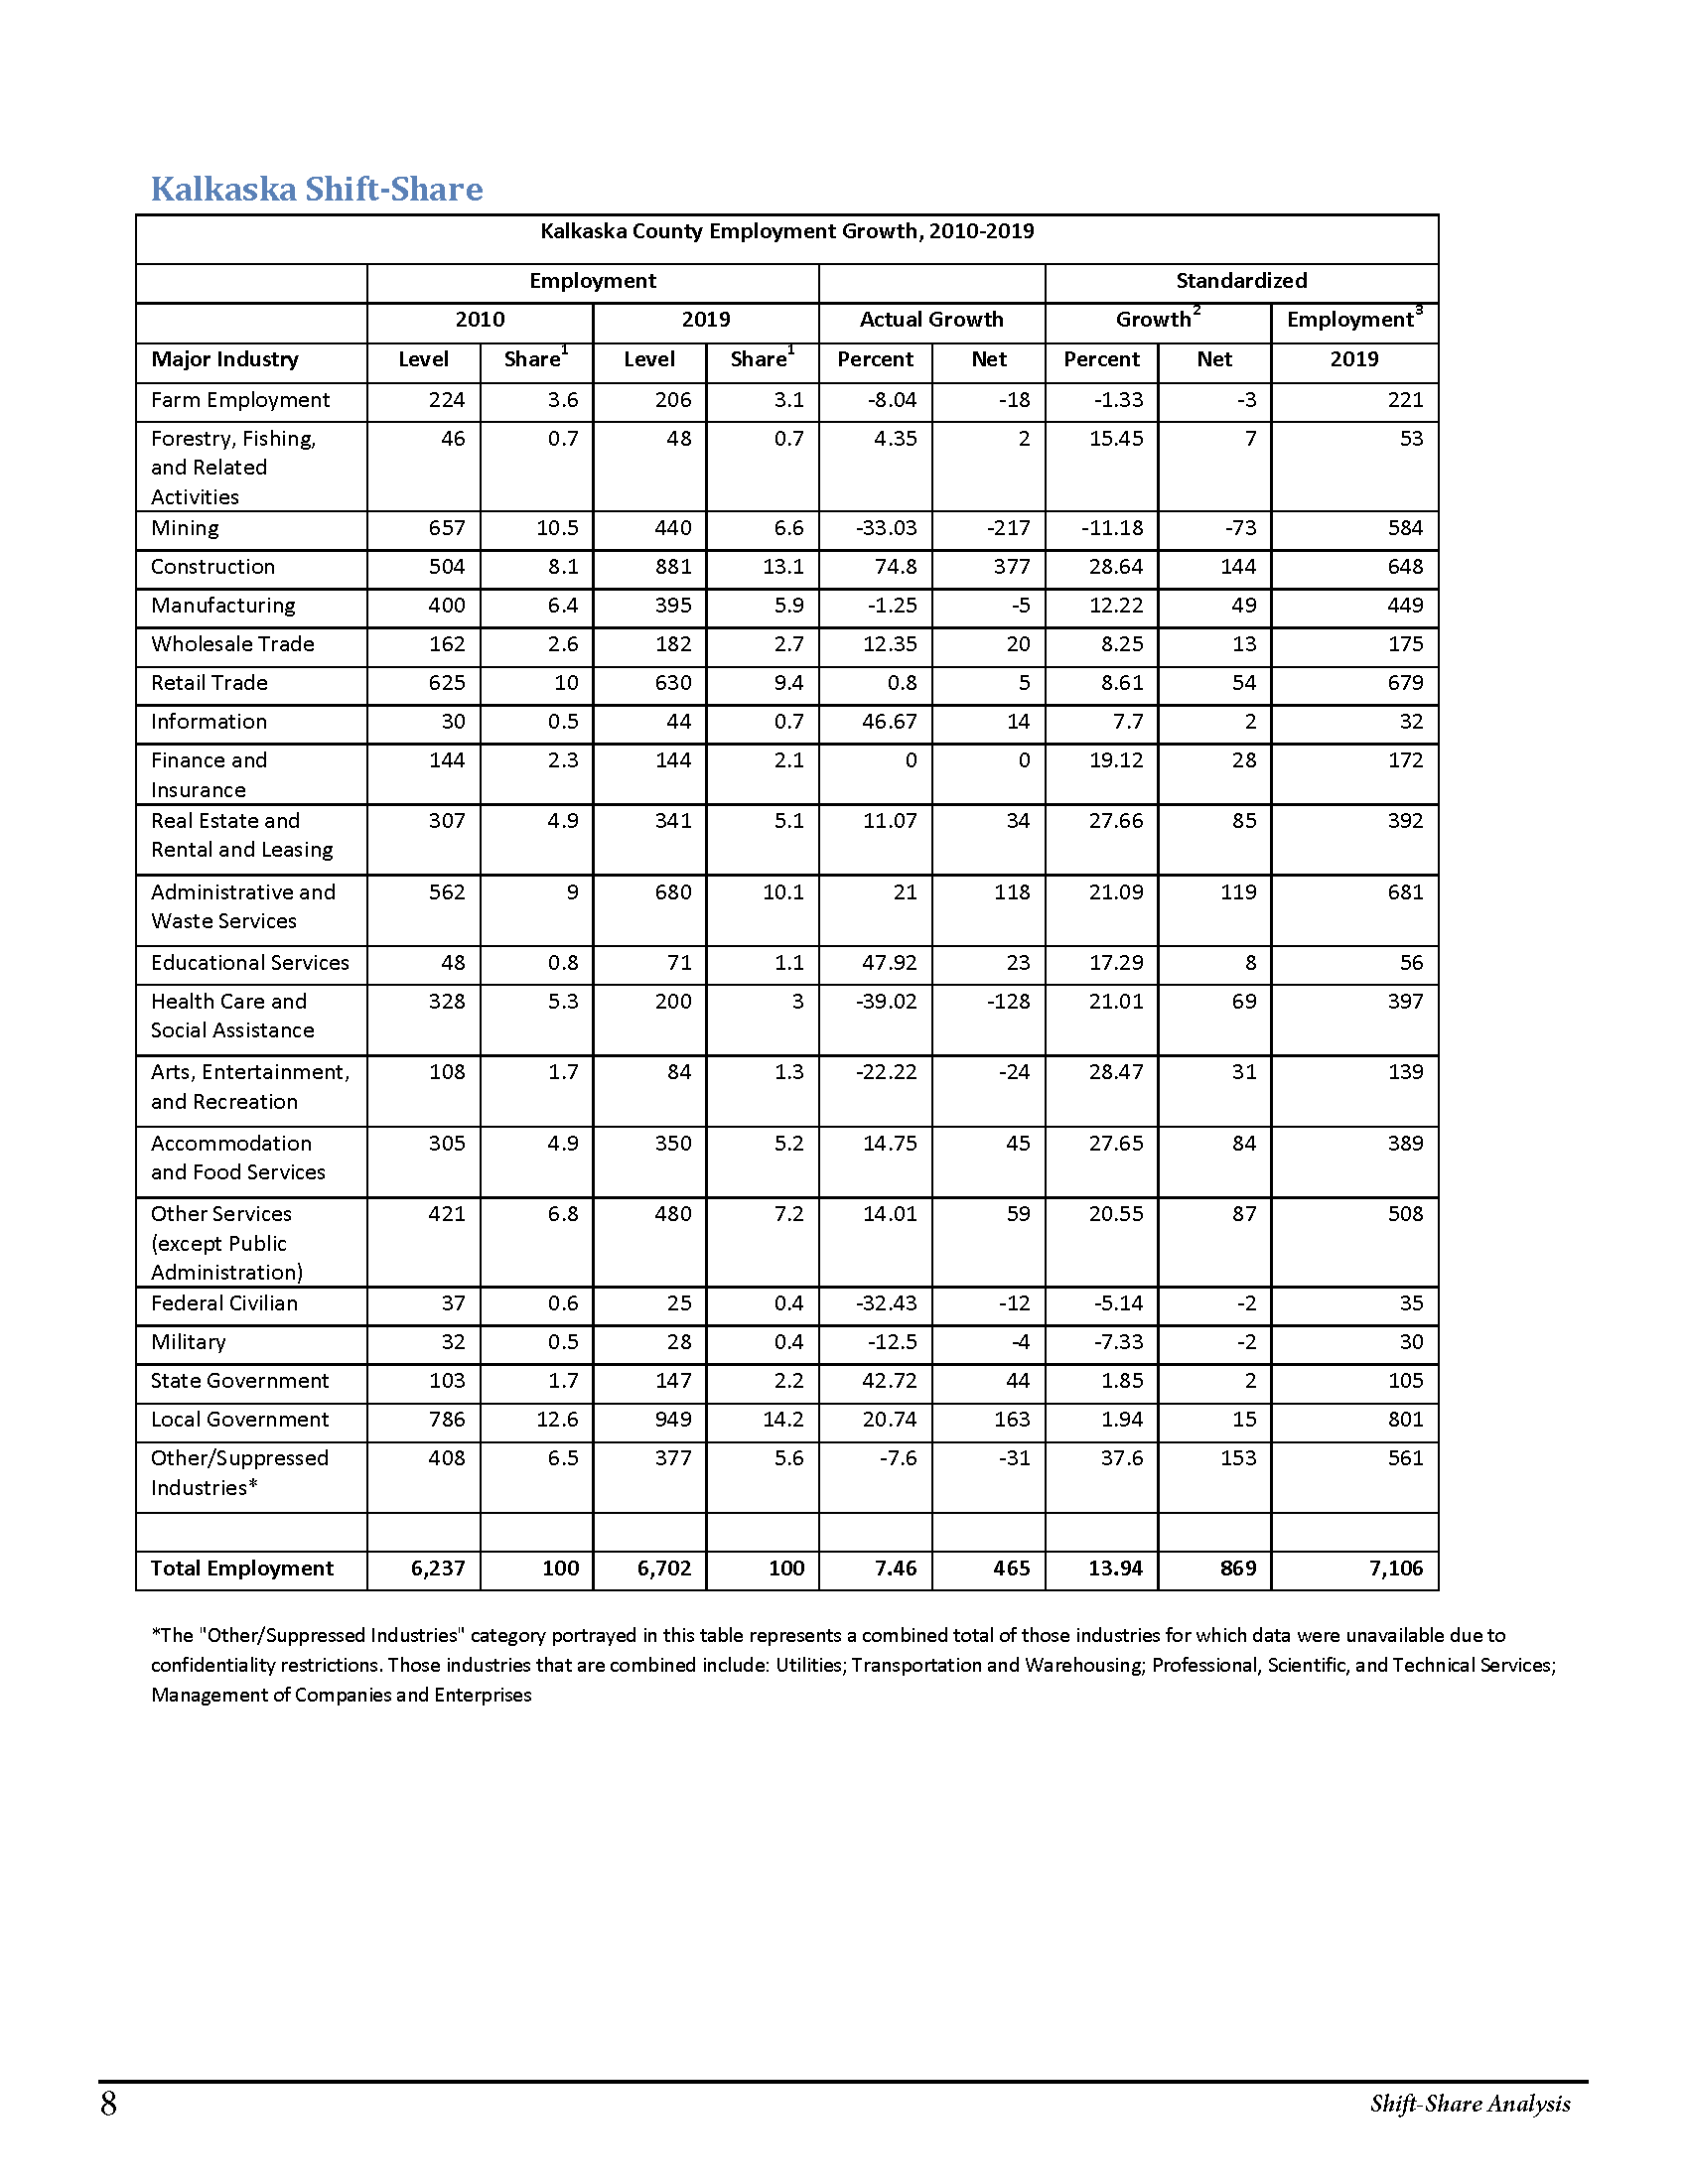
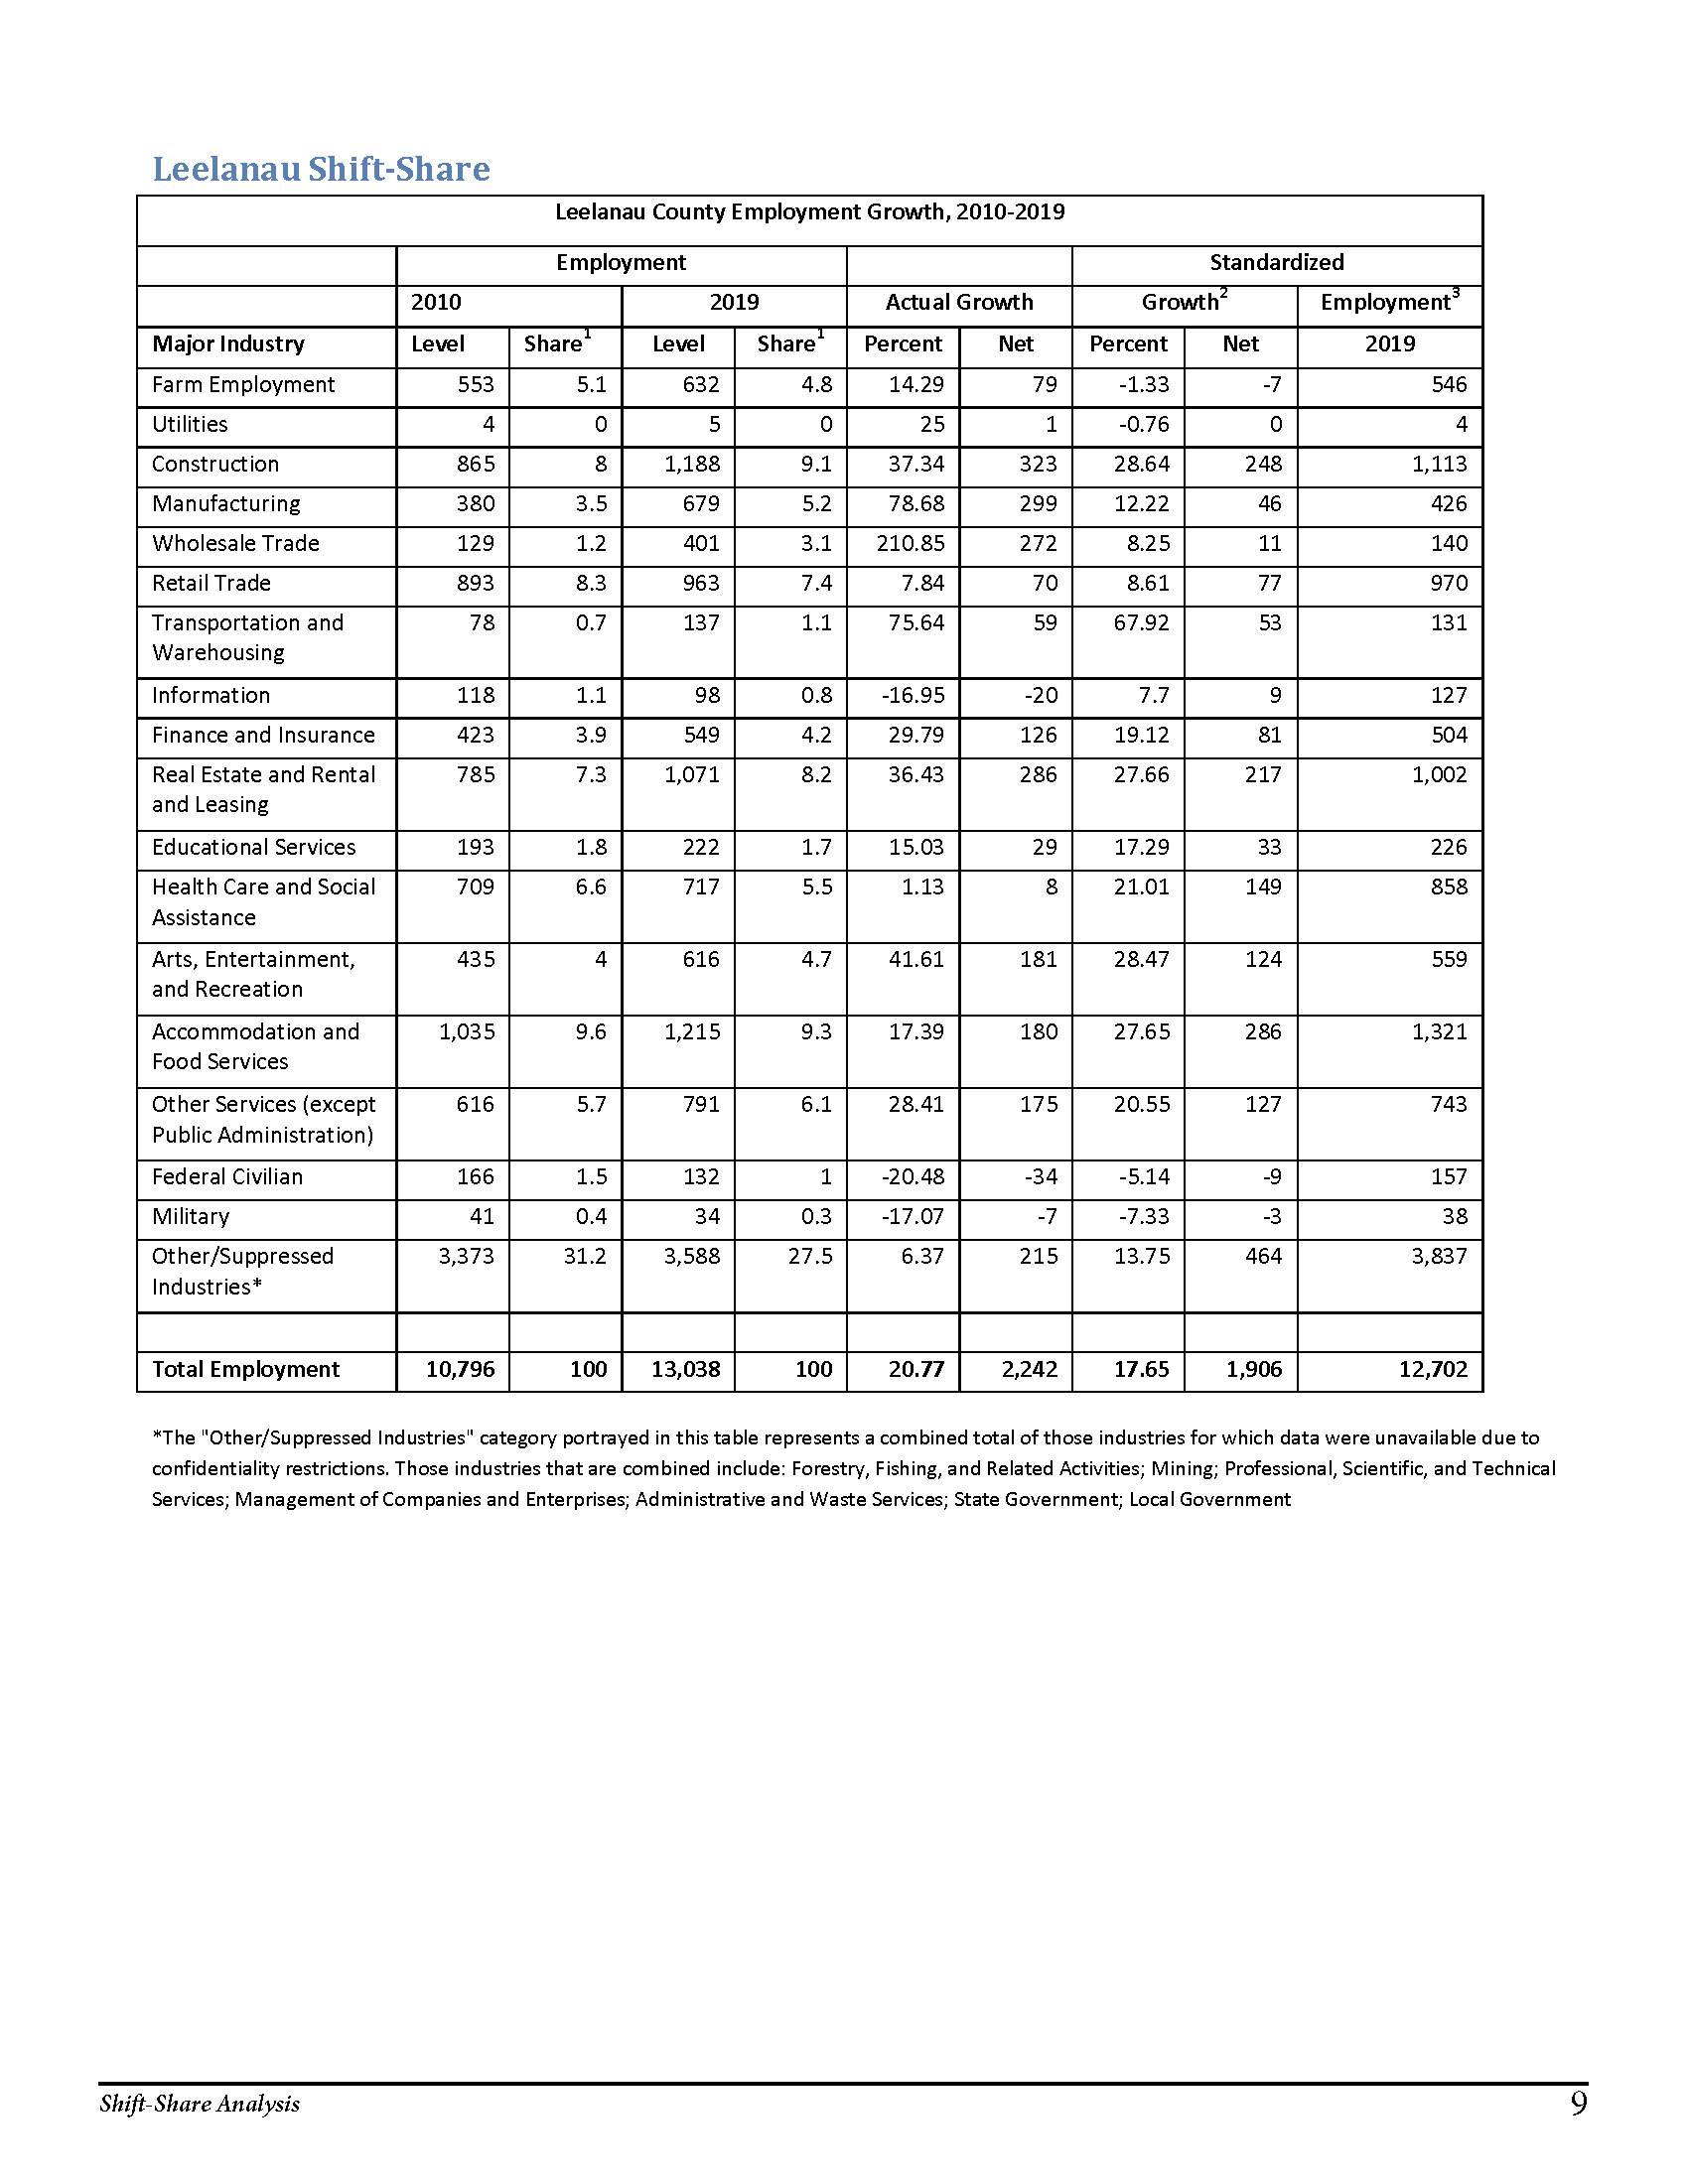
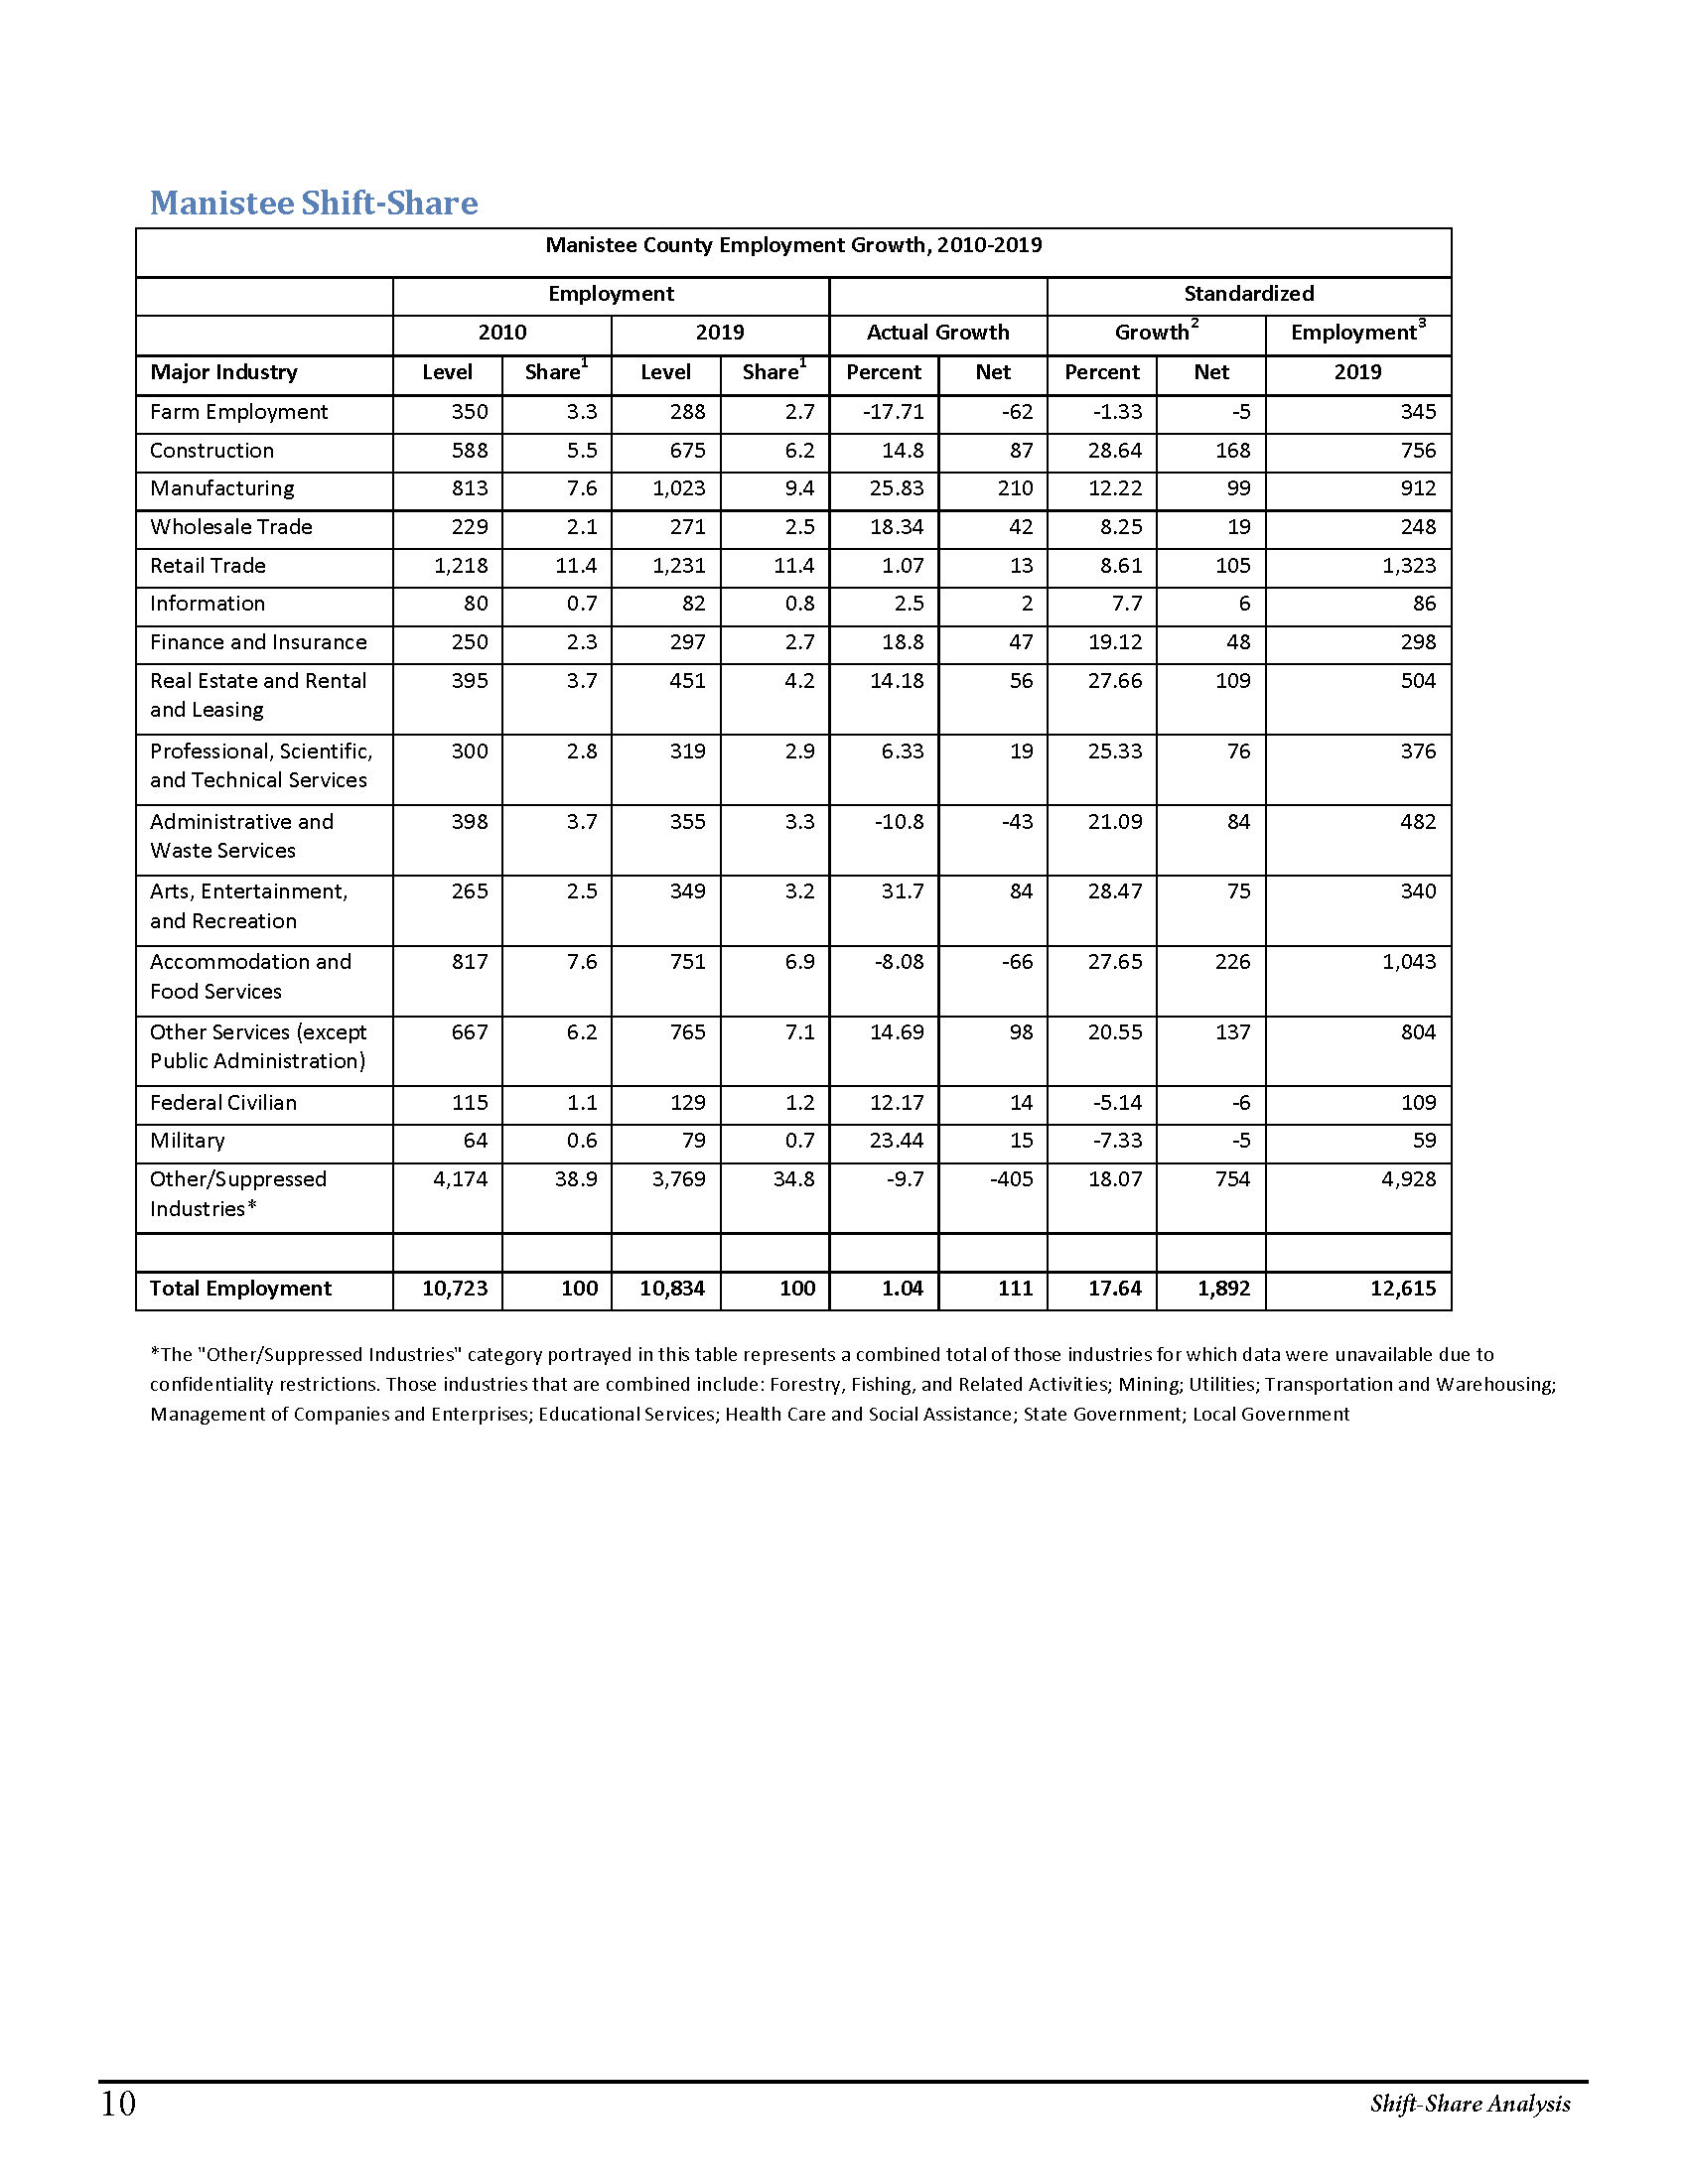
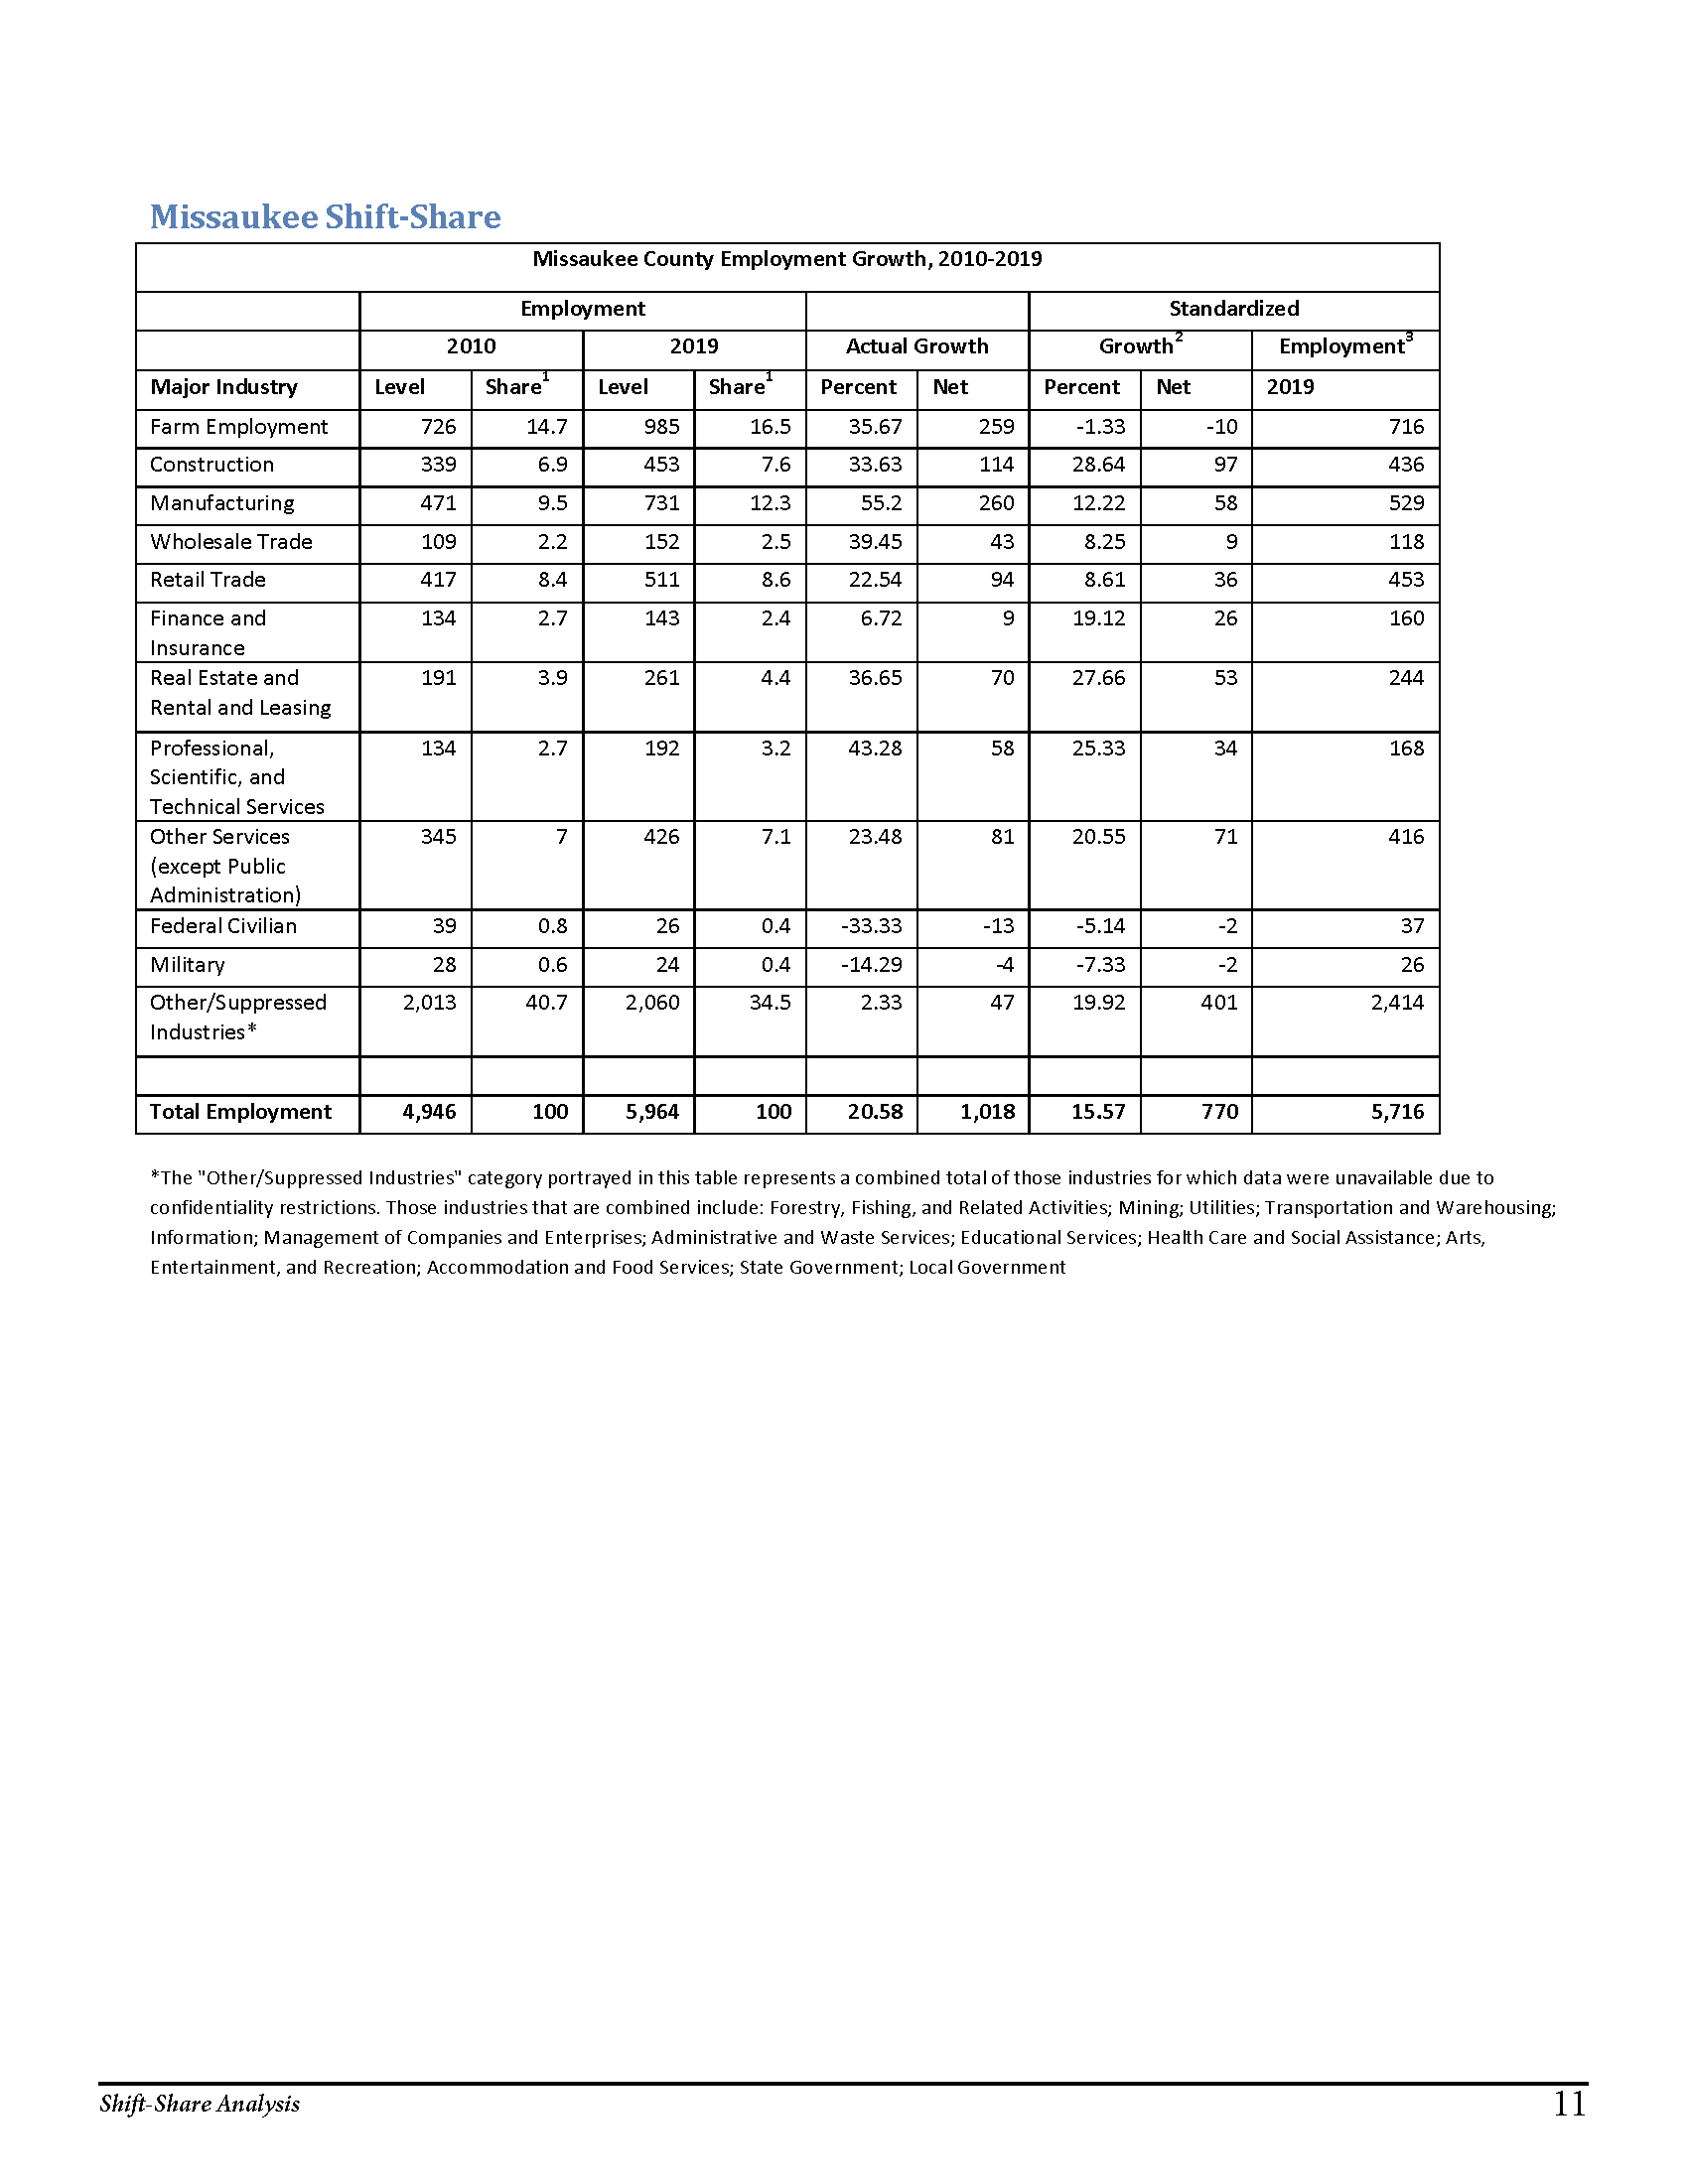
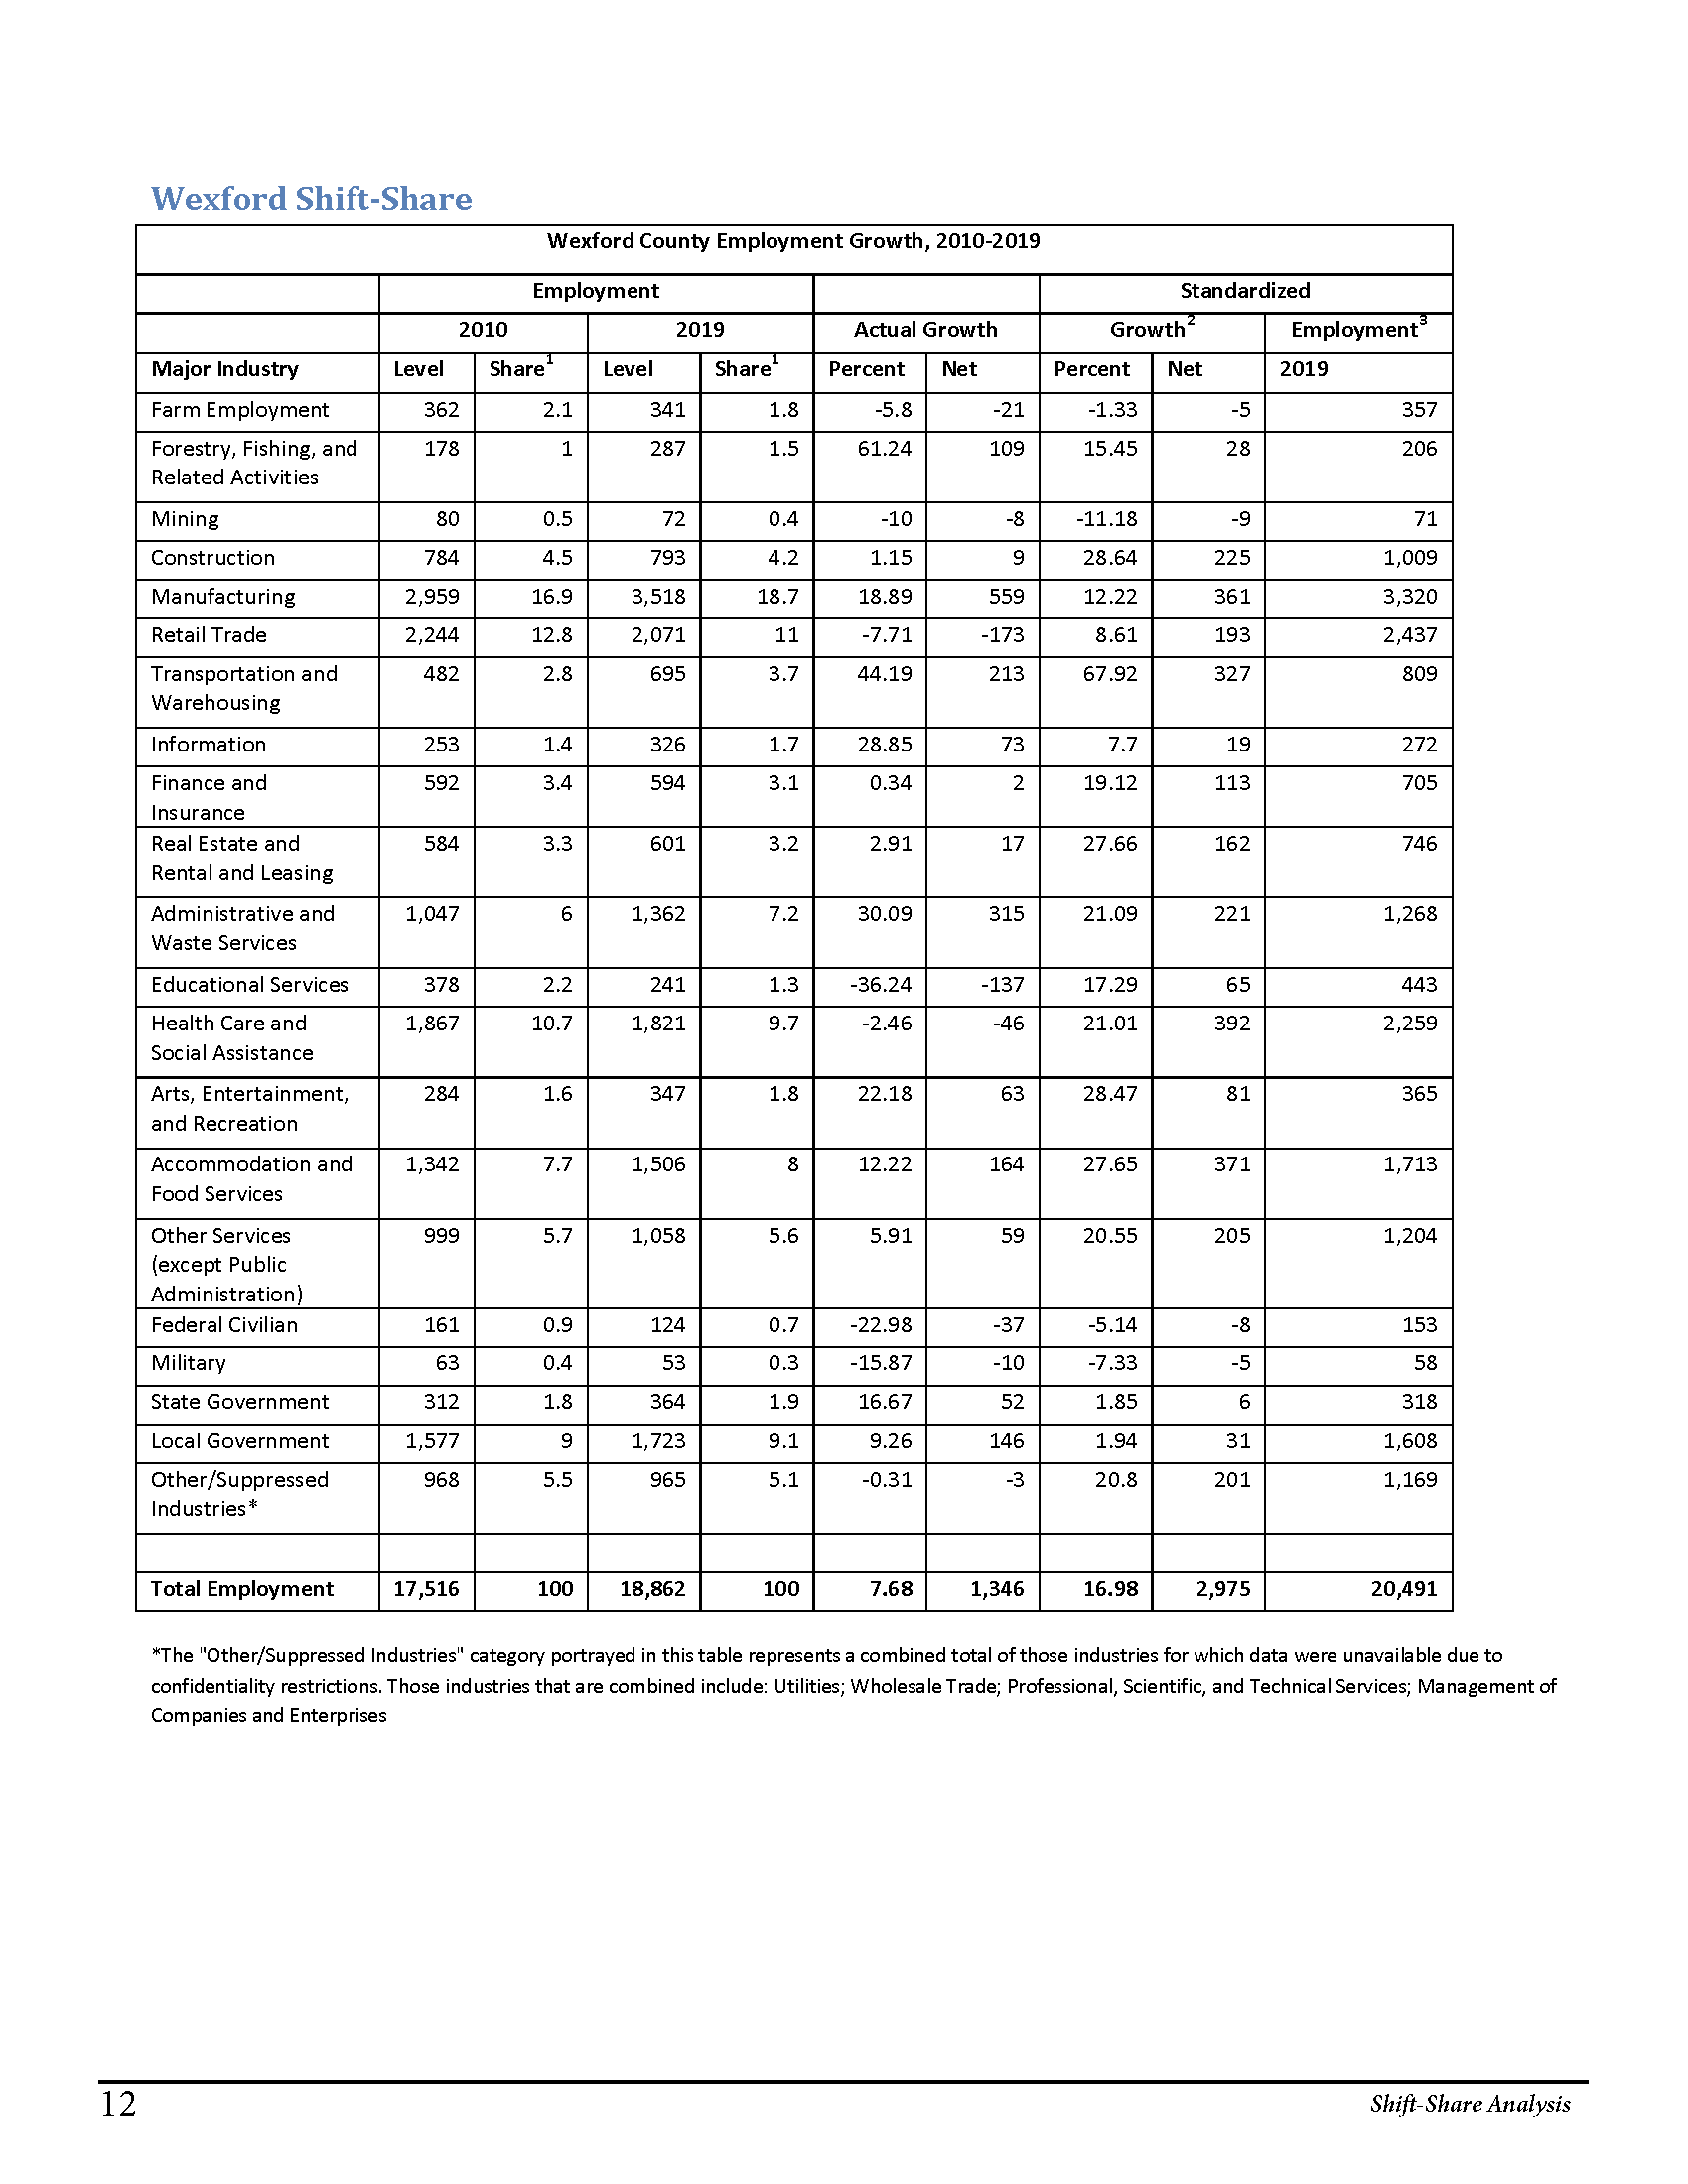
The shift-share analysis is used to show the growth of major industries for a particular area, in this case counties, and how each industry has changed as a proportion of all local employment. The tables in this section display each of the major industries, their total employment for the respective county from 2010-2019, the degree to which that total has changed in the last decade, as well as the percent share of employment that each industry represents and how that has changed over the decade. For example, you can see in Table 1 for Emmet that the Health Care and Social Assistance industry has added 104 jobs from 2010-2019 but now makes up only 13.7% of local employment in 2019 compared to 15.1% in 2010.
So while that industry has grown, it hasn’t grown at the same rate as other industries and now represents a smaller share of the total local employment. This table basically provides a snapshot of how employment in these sectors has changed, or stayed the same, since 2010. The standardized growth and employment columns show how those industries “should” have grown or declined based on national trends. For example, in Emmet you can see in its shift-share table that the Construction industry grew from employing 1,765 people in the county in 2010 to 2,337 people in 2019. If the Construction industry had grown at a rate on par with national trends, the employment in 2019 would be just 2,270 people (Standardized Employment column of the table). This means that Construction in Emmet is outperforming national growth rates for that industry. Please note the data limitations and excluded industries for each county at the bottom of its data table.
For each table:
1 Share: The percentage share of total employment by industry.
2 Standardized Growth: at the same rate as its counterpart at the national level had each industry grown.
3 Standardized Employment, 2019: The 2019 level of employment in each industry had it grown at the same rate as its counterparts at the national level since 2001.
Source: Calculations by the Michigan Regional Economic Analysis Project (MI-REAP) with data provided by the U.S. Department of Commerce, Bureau of Economic Analysis
